Ever wondered what’s really happening inside your apps?
From slow endpoints to hidden errors, application blind spots can cost you time, money, and customer trust. But what if you could follow every request, catch every bug, and optimize every service—live?
In this post, you’ll discover how to turn your Spring Boot and Flask applications into open books with ELK APM. Get ready for a hands-on, real-world guide to true observability—so you can build faster, fix smarter, and sleep better at night!
I/Introduction: Why APM is Essential:
As software engineers, we love writing code that works. But as applications grow, so do the mysteries: Where is the bottleneck? Why did my API spike latency at 2am? Which microservice is slowest right now?
That’s where APM (Application Performance Monitoring) comes in. With modern APM, you don’t just watch server health—you follow every transaction, every trace, and every bottleneck, end-to-end. And with the open-source ELK (Elasticsearch, Logstash, Kibana) stack, plus Elastic APM, you can achieve world-class observability—for free!
🔍 What is ELK APM?
ELK APM is the observability suite from Elastic, part of the popular ELK Stack. It gives you:
- Traces: See how a request flows through your app and all microservices.
- Metrics: JVM/CPU/memory usage, request rates, error rates, and more.
- Logs: Correlated with your traces.
- Rich Kibana Dashboards: Real-time visualization and troubleshooting.
Main components:
- Elastic APM Server: Collects traces/metrics from your apps and sends to Elasticsearch.
- APM Agents: Libraries for Java, Python, Node.js, etc. Instruments your code with zero/minimal changes.
- Elasticsearch & Kibana: Storage and visualization.
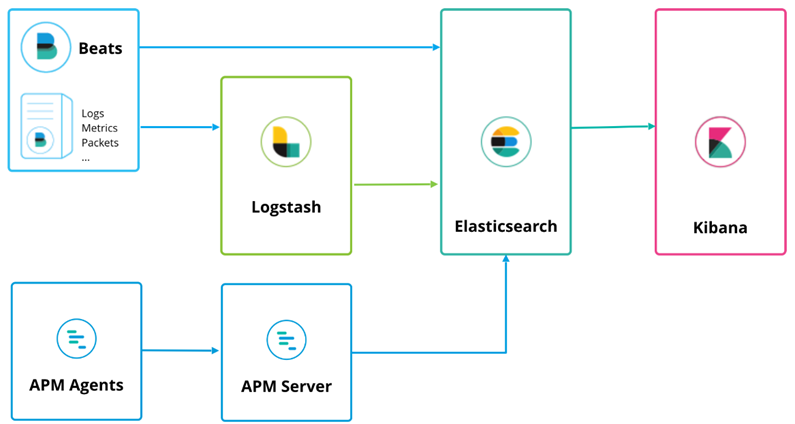
🛠️ Architecture Overview: How Elastic APM Connects Your Apps to Observability
When you implement ELK APM monitoring, your application’s journey from user request to visualized trace in Kibana follows a simple but powerful pipeline. Let’s break down each component and how they connect:
1. Application Layer
- Spring Boot (Java) or Flask (Python) application runs your business logic.
- APM Agent is attached to your application (Java agent as a JVM argument, Python agent as a pip package and wrapper).
- The agent automatically instruments your code to capture transactions, traces, errors, and key metrics with little or no code modification.
2. APM Agent
- The APM agent sits inside the app process.
- It captures:
- Transaction traces: Each HTTP/API request, database call, or external service call.
- Errors/exceptions: Stack traces, error rates, and details.
- Performance metrics: Response times, throughput, CPU/memory (for Java).
- Agents batch and send this telemetry data over HTTP(S) to the APM Server.
3. APM Server
- APM Server is a lightweight service that acts as the gateway between your instrumented apps and the ELK stack.
- It receives telemetry data from agents and forwards it in the correct format to Elasticsearch.
- Supports data validation, transformation, and security filtering.
4. Elasticsearch
- Elasticsearch is the backbone storage and search engine of the ELK stack.
- Stores:
- APM traces
- Service metrics
- Application logs (if using Filebeat/Logstash)
- Enables blazing-fast search, aggregation, and complex queries over millions of events.
5. Kibana
- Kibana is the visualization and analytics UI.
- Allows you to:
- Explore your service map
- View real-time traces and metrics
- Analyze latency, bottlenecks, errors, and dependencies
- Set up dashboards and alerts
- Provides APM dashboards out-of-the-box for your Spring Boot and Flask services.
II/Demo 1: Monitoring a Java Spring Boot App
Let’s go hands-on. We’ll instrument a real Spring Boot app without touching your codebase using the Elastic APM Java Agent.
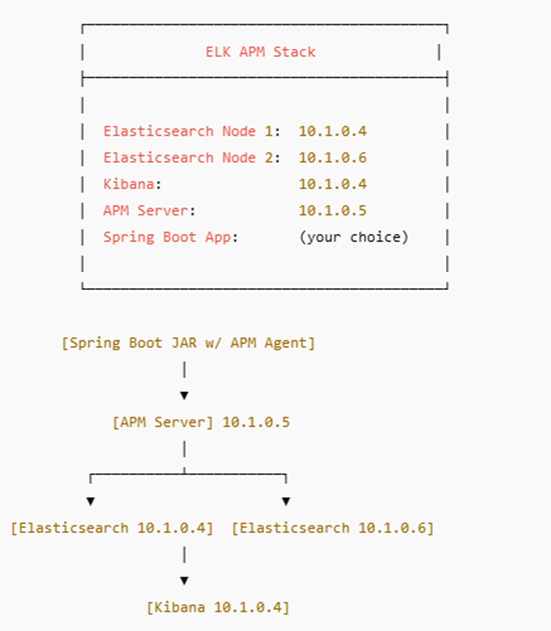
🟢Step 1: Prepare Your Environment
- System Architecture with IP Mapping
1. Prerequisites
- Java 17+ installed
- Maven installed (
mvn) - Git installed
- Elastic Stack (Elasticsearch, Kibana, APM Server) up and running
2. Clone the Spring PetClinic Project
git clone https://github.com/spring-projects/spring-petclinic.git
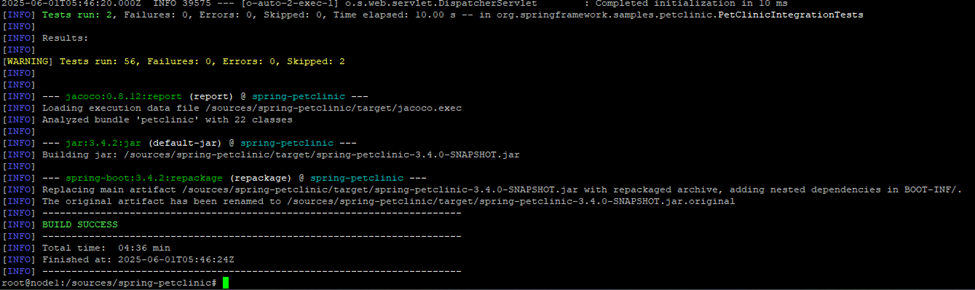
cd spring-petclinic3. Build the JAR File:
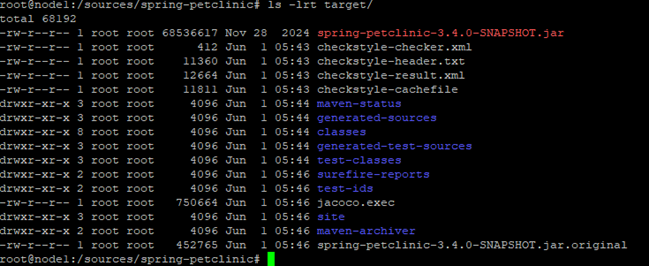
./mvnw clean packageAfter a successful build, your JAR file will be in: target/spring-petclinic-3.2.0.jar
4. Download the Elastic APM Java Agent
wget https://search.maven.org/remotecontent?filepath=co/elastic/apm/elastic-apm-agent/1.47.0/elastic-apm-agent-1.47.0.jar -O elastic-apm-agent.jar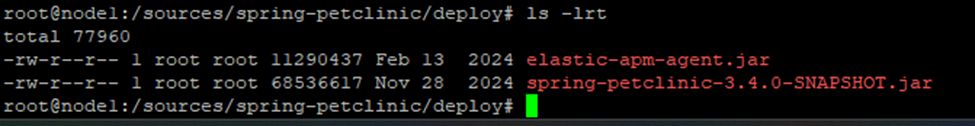
🟢Install Elastic APM Server on Node 10.1.0.5
1. Install APM Server and configure APM Server to start automatically during boot:
wget -qO - https://artifacts.elastic.co/GPG-KEY-elasticsearch | sudo apt-key add -
sudo apt-get install apt-transport-https
echo "deb https://artifacts.elastic.co/packages/7.x/apt stable main" | sudo tee -a /etc/apt/sources.list.d/elastic-7.x.list
sudo apt-get update && sudo apt-get install apm-server
sudo systemctl enable apm-server
2. Configure APM Server to point to Elasticsearch cluster:
- Edit /etc/apm-server/apm-server.yml:
apm-server:
  host: "0.0.0.0:8200"
output.elasticsearch:
  hosts: ["https://10.1.0.4:9200", "https://10.1.0.6:9200"]

  protocol: "https"
  username: "elastic"
  password: "your_password_here"

  ssl.enabled: true
  ssl.verification_mode: none
3. Start APM-Server And Add APM Server Integration in Kibana:
sudo systemctl start apm-server– Open Kibana in your browser, e.g. https://10.1.0.4:5601/
– In Kibana, go to Observability and choose the APM section (usually found in the left sidebar menu)
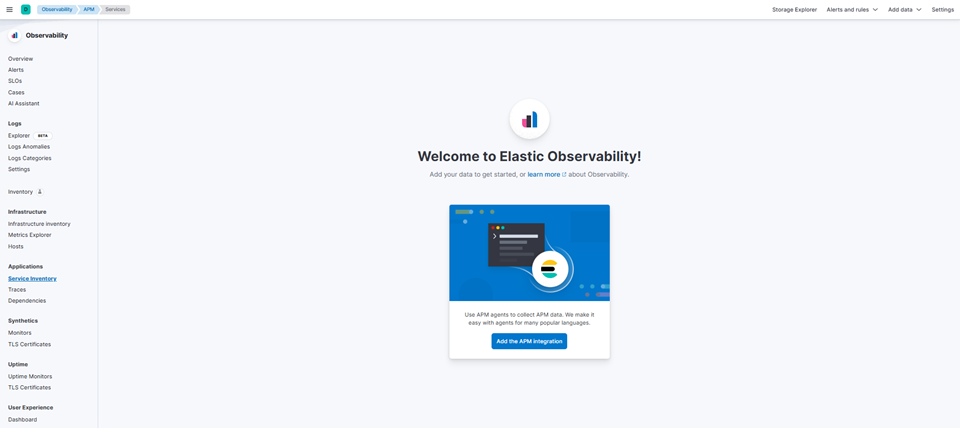
– Click “Add the APM integration > Add Elastic APM
- You will be guided through a simple wizard.
- Typically, you can accept the default settings, which set up APM pipelines, index templates, and dashboards.
- If prompted, you can specify the APM Server URL (e.g.,
http://10.1.0.5:8200)
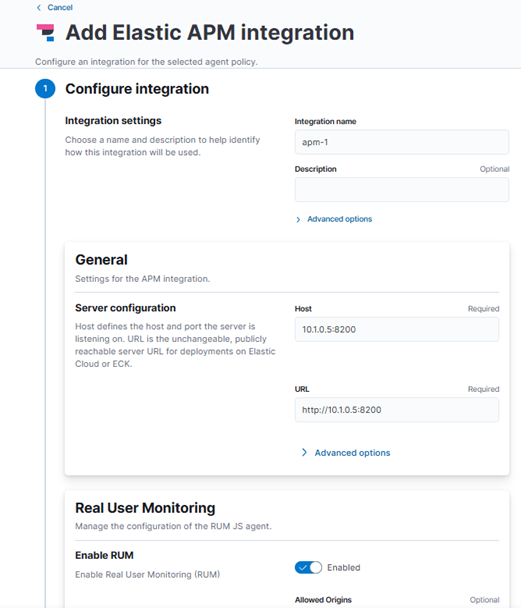
– Click “Save and Continue“
🟢Step 3: Deploy the Spring Boot JAR App and Integrate with APM Server
Now that your APM Server is running and integrated with Kibana, it’s time to deploy your Spring Boot application and start sending APM data.
1. Make Sure You Have the Required Files:
- Your built Spring Boot JAR file (e.g.,
spring-petclinic-3.4.0-SNAPSHOT.jar) ·
- The Elastic APM Java Agent JAR (e.g elastic-apm-agent.jar)
2. Run the Spring Boot Application with APM Agent:
java -javaagent:./elastic-apm-agent.jar \
     -Delastic.apm.server_urls=http://10.1.0.5:8200 \
     -Delastic.apm.service_name=apm-app-demo \
     -Delastic.apm.environment=production \
     -Delastic.apm.application_packages=org.springframework.samples.petclinic \
     -jar ./spring-petclinic-3.4.0-SNAPSHOT.jar
Parameter explanations:
- -javaagent – tells the JVM to load the APM agent.
- elastic.apm.server_urls – the address of your APM Server (10.1.0.5).
- elastic.apm.service_name – how your app will appear in Kibana APM.
- elastic.apm.environment – tag for filtering in Kibana (e.g., production, staging, dev).
- elastic.apm.application_packages – your app’s root Java package for detailed tracing.
Tip: You can also set these parameters as environment variables instead of JVM args if you prefer
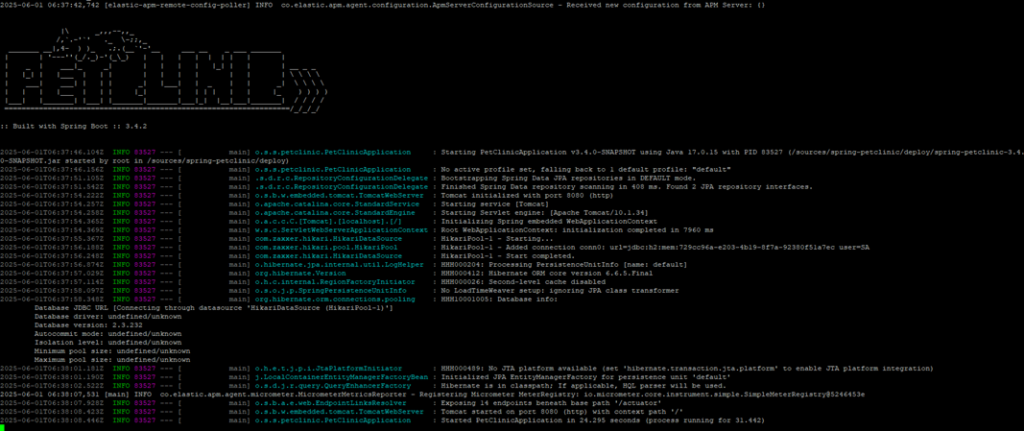
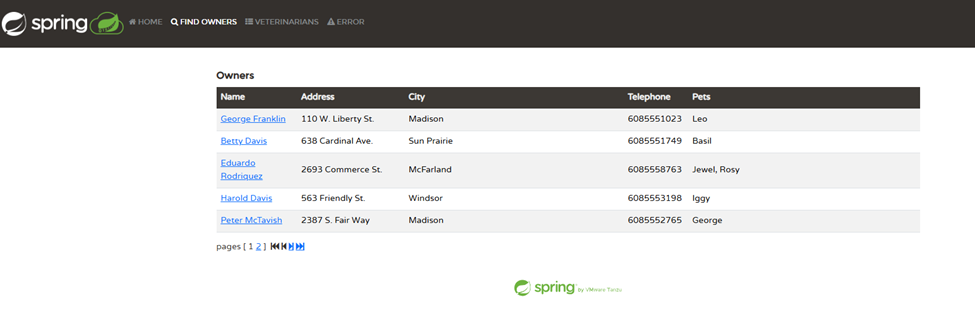
3. Generate Some Application Traffic:
Open your app in a browser or use tools like curl or hey to make sample requests. This ensures the agent has real requests to trace and report to the APM Server.
🟢Step 4: View APM Dashboard in Kibana
After your app sends traces to the APM Server, you’ll want to see and explore that data in Kibana’s APM dashboard.
– Open Kibana in your browser (e.g., http://10.1.0.4:5601/).
– From the left sidebar, choose Observability → APM
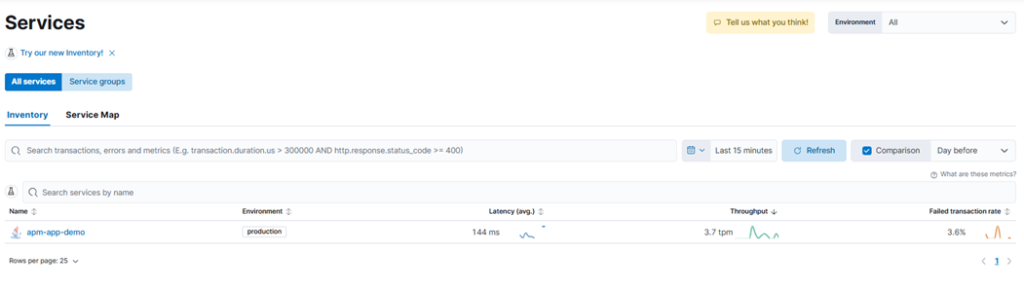
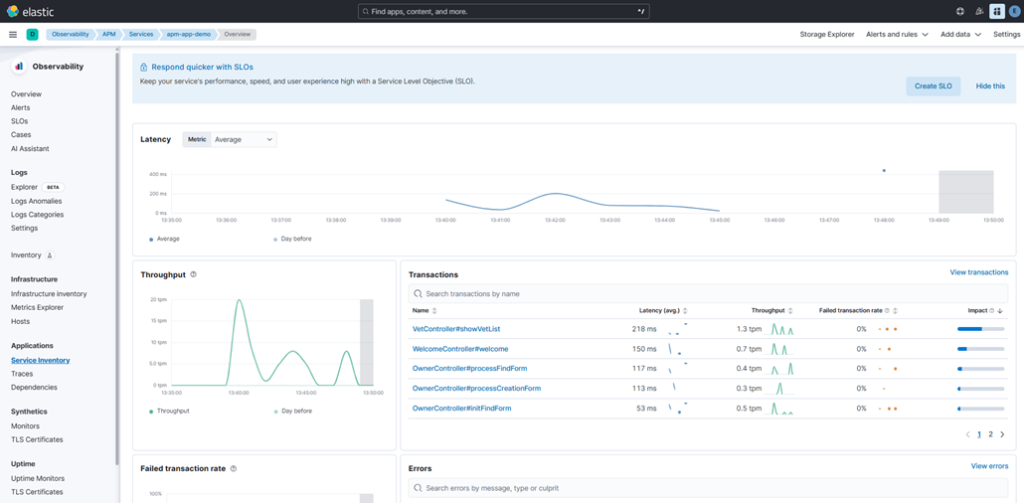
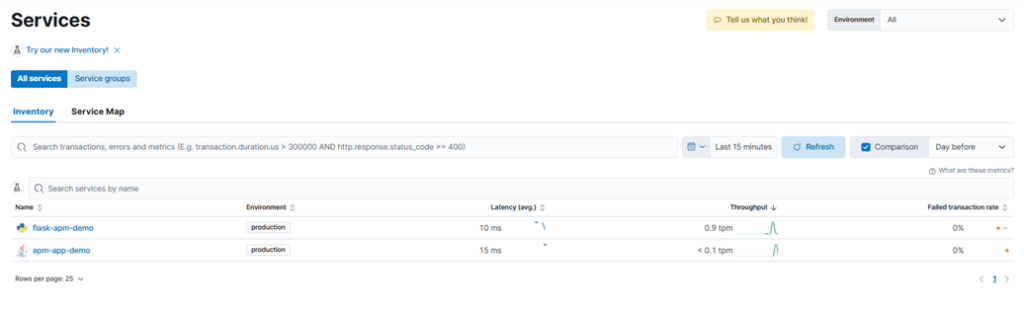
- After a few seconds to a minute, you should see your service (e.g., apm-app-demo) listed in the APM Services overview.
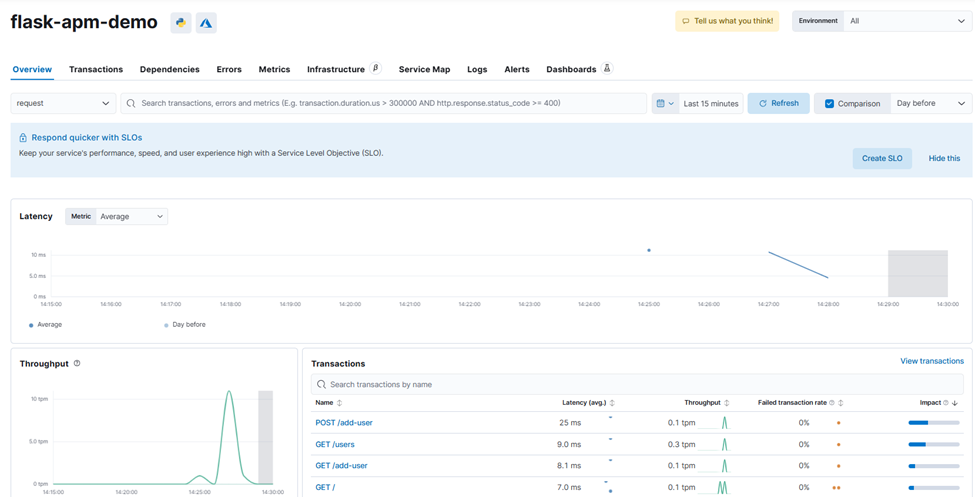
- Click your service name to view:
- Transaction traces and breakdowns
- Latency and throughput charts
- Request and error rates
- Distributed traces (if you have multi-service apps)
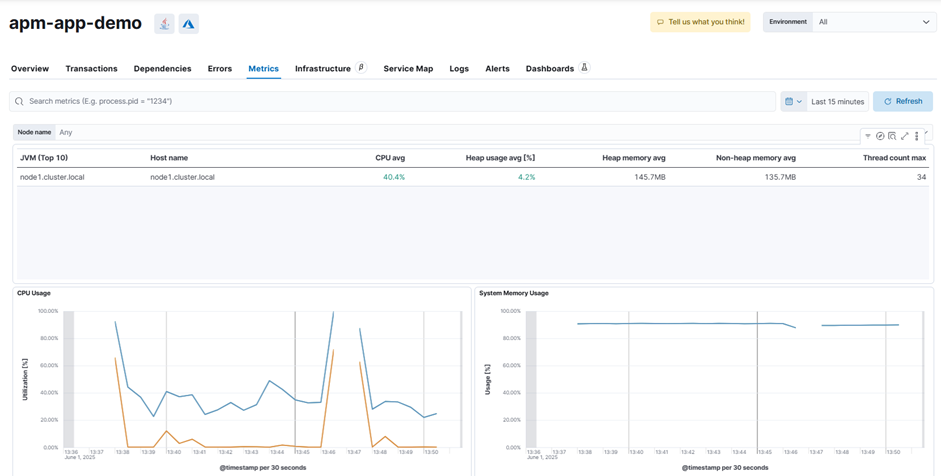
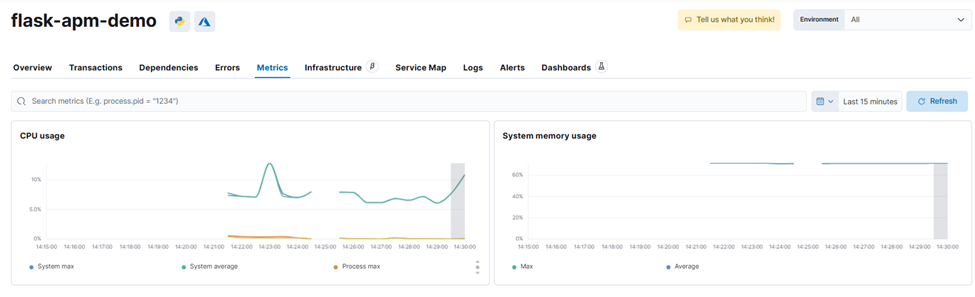
– The Metrics tab in Kibana’s APM dashboard gives you deep visibility into your application’s runtime environment. For Java applications, you can use this tab to monitor key JVM metrics such as heap memory usage, garbage collection activity, thread counts, CPU consumption, and more.
– These real-time insights help you quickly identify performance bottlenecks and optimize your resource allocation, ensuring your Spring Boot service runs smoothly and efficiently.

III/Demo 2: Monitoring a Python Flask App with Elastic APM
After supercharging our Java Spring Boot app with Elastic APM, let’s see how easy it is to bring full-stack observability to Python with Flask. For this demo, we’ll use a real-world open-source project: flask-sqlite. This example gives us a simple, database-driven web app to monitor
1. Clone and Set Up the Flask App
First, let’s get the code and its dependencies:
apt install python3.8-venv
git clone https://github.com/uwi-info3180/flask-sqlite.git
cd flask-sqlite
python3 -m venv venv
source venv/bin/activate
pip install -r requirements.txt
This will create a virtual environment and install all required Python packages
2. Install the Elastic APM Python Agent
pip install elastic-apm[flask]3. Edit Your Flask App Code
Open your main Flask app file (app/__init__.py), and add the following lines after your Flask app is created:
from flask import Flask
from elasticapm.contrib.flask import ElasticAPM

app = Flask(__name__)

# Configure Elastic APM
app.config['ELASTIC_APM'] = {
    'SERVICE_NAME': 'flask-apm-demo',             # Name as it will appear in Kibana APM
    'SERVER_URL': 'http://10.1.0.5:8200',            # Your APM Server endpoint
    'ENVIRONMENT': 'production',                     # Environment tag (prod, staging, dev, etc.)
}

# Initialize the APM agent with your Flask app
apm = ElasticAPM(app)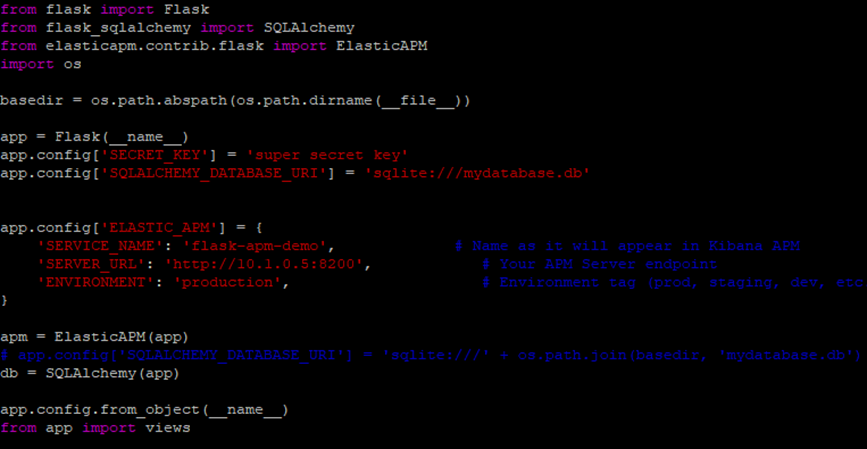
4. Run Your Flask App as Usual
export FLASK_RUN_HOST=0.0.0.0
export FLASK_RUN_PORT=8080
flask run
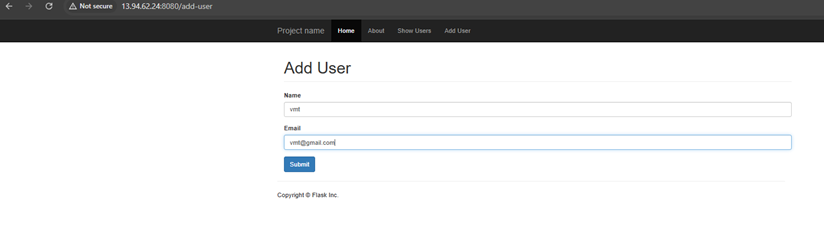
5. Generate Some Requests
Visit your app in the browser and make some requests. You should see your traces appear in Kibana’s APM dashboard within a minute or so

6. View APM Dashboard in Kibana
After your app sends traces to the APM Server, you’ll want to see and explore that data in Kibana’s APM dashboard
✨Conclusion: From Blind Spots to Full Visibility ✨
Application monitoring is no longer a luxury—it’s a superpower.
With Elastic APM and the ELK Stack, you’ve transformed your Java and Python applications from black boxes into fully observable systems. Whether you’re tracking memory leaks in Spring Boot, pinpointing slow queries in Flask, or catching errors before your users do, you now have real-time, end-to-end insight at your fingertips.
What did we achieve together?
- We instrumented real-world Spring Boot and Flask apps—both the classic way and with code-based Python integration.
- We set up a robust, distributed observability stack on multiple nodes.
- We explored traces, metrics, and resource usage—turning complexity into clarity.
But this is just the beginning!
With Elastic APM, you can monitor any tech stack, scale to microservices, set up smart alerts, and keep your systems humming—whether you’re running on-prem, in the cloud, or across the world.
No more flying blind.
With every request, every error, and every spike at your command, you’re empowered to build faster, deploy with confidence, and deliver the rock-solid experiences your users deserve.
Happy monitoring—and may your logs always tell a great story! 🚀