
🌟Your LAMP stack is running… but do you really know what it’s doing?
You’ve got Apache serving pages, MySQL crunching data, and PHP holding it all together — but beneath the surface, dozens of performance bottlenecks and silent errors could be building up.
What if you could visualize your entire stack in real time — CPU spikes, slow queries, request surges — all on a live dashboard, with zero guesswork?
In this guide, we’ll walk you through building a fully automated monitoring system using the ELK Stack (Elasticsearch + Kibana) and Metricbeat — no need to write custom scripts or wrangle log files.

You’ll learn how to:
- Track server health (CPU, memory, disk, network)
- Visualize Apache performance (requests, errors, worker load)
- Monitor MySQL metrics (query rates, connections, locks)
- Build dashboards that actually help you diagnose and optimize
Whether you’re running a SaaS app, an internal portal, or a client site — this setup gives you reliable, real-time visibility across your LAMP infrastructure.
⚡ Ready to stop guessing and start knowing? Let’s dive in
I/Environment Preparation: Setting Up a LAMP Stack Across Two Ubuntu Servers:
Before we dive into monitoring the LAMP stack with Metricbeat and ELK, we need to set up a simple, working application to generate real metrics.
For this setup, we’ll split our environment into two Ubuntu servers:
- One server will host the web application (Apache + PHP).
- The second server will host the MySQL database separately
This separation mimics a real-world production environment, making it perfect for testing Metricbeat monitoring later.
🖥️ Server 1: Apache + PHP Web Server (Ubuntu 1)
1/Step 1: Install Apache, PHP, and Git:
First, make sure your server is updated and all necessary packages are installed:
sudo apt update
sudo apt install apache2 php libapache2-mod-php php-mysqli git- apache2: the web server.
- php, libapache2-mod-php, php-mysqli: run PHP and connect to MySQL.
- git: used to pull the application code from GitHub.
2/ Step 2: Clone the Application from GitHub:
Navigate to Apache’s default document root:
cd /var/www/html/Remove the default index.html if it exists:
sudo rm index.htmlClone your PHP application directly into /var/www/html:
sudo git clone https://github.com/vominhtri1991/ELK-Monitoring-LAMP.git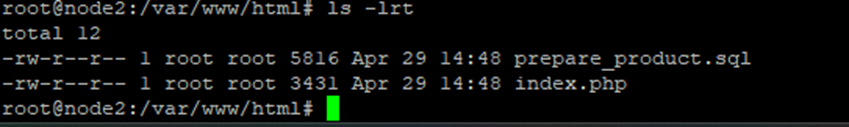
Make sure Apache can access and serve the application files:
sudo chown -R www-data:www-data /var/www/html/Then restart Apache:
sudo systemctl restart apache22/ Step 3: Configure Database Connection
Inside your project, open index.php or your database configuration file, and set the correct credentials:
$servername = "IP_ADDRESS_OF_MYSQL_SERVER"; // <-- Set this to your MySQL server IP
$username = "your_mysql_user";
$password = "your_mysql_password";
$dbname = "shopdb";
✅ At this point, the PHP frontend is ready to connect to a remote MySQL server!
🛢️ Server 2: MySQL Database Server (Ubuntu 2)
1/Step 1: Install MySQL Server
Install MySQL if you haven’t already:
sudo apt update
sudo apt install mysql-server
2/Step 2: Allow Remote MySQL Connections
Edit the MySQL configuration file:
sudo vi /etc/mysql/mysql.conf.d/mysqld.cnfFind the line:
bind-address = 127.0.0.1Change it to:
bind-address = 0.0.0.0This allows MySQL to accept remote connections. Restart MySQL
sudo systemctl restart mysql3/Step 3: Prepare the Database and Table
Now that MySQL is running and accessible, let’s set up the database environment properly for the shopping application.
We’ll create:
- A new database named shopdb
- A dedicated MySQL user appshopping with the password appshopping@123
- Proper permissions so this user can access only shopdb and nothing else
3.1 Create the Database
First, log into the MySQL shell:
sudo mysql -u root -pCreate the application database:
CREATE DATABASE shopdb;

3.2 Create the products Table
Switch to the new database:
USE shopdb;Then create a simple products table:
CREATE TABLE products (
    id INT AUTO_INCREMENT PRIMARY KEY,
    name VARCHAR(255) NOT NULL,
    price DECIMAL(10,2) NOT NULL,
    description TEXT
);
3.3 Create a Dedicated MySQL User for the Application
Still inside the MySQL shell, create a new user called appshopping and set its password:
CREATE USER 'appshopping'@'%' IDENTIFIED BY 'appshopping@123';
Grant full privileges on the shopdb database to the appshopping user:
GRANT ALL PRIVILEGES ON shopdb.* TO 'appshopping'@'%';
FLUSH PRIVILEGES;
This ensures that your web application will not use the root user for database operations — a good security practice.
Exit MySQL
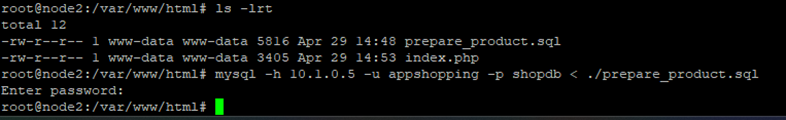
EXIT;3.4 Insert Sample Products from SQL Script
Use a prepared SQL file named prepare_product.sql (containing 100 sample products), load it into shopdb using the new appshopping user:
mysql -h IP_ADDRESS_OF_MYSQL_SERVER -u appshopping -p shopdb < ./prepare_product.sqlEnter the password (appshopping@123) when prompted.
✅ Now your products table is fully populated and ready for the application
🎯 Final Check: Verify Your PHP Shopping App is Running
After completing all deployment steps, it’s time to check if everything is working properly.
Here’s how you can quickly verify:
Navigate to your Apache server’s IP address:
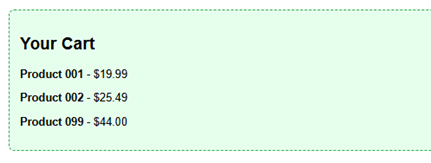
http://IP_ADDRESS_OF_WEB_SERVER/You should see your shopping website’s homepage displaying a list of products.
Each product should show:
- Name
- Price
- Description
- “Add to Cart” button
✅ If the page loads correctly and displays products, your PHP web server is successfully connecting to the remote MySQL database.

II/Step-by-Step: Install and Configure ELK Stack + Metricbeat:
✅ Step 1: Install Metricbeat on App and DB Servers
Install Metricbeat (repeat on both Apache and MySQL servers):
wget -qO - https://artifacts.elastic.co/GPG-KEY-elasticsearch | sudo apt-key add -
sudo apt-get install apt-transport-https
echo "deb https://artifacts.elastic.co/packages/9.0/apt stable main" | sudo tee -a /etc/apt/sources.list.d/elastic-9.0.list
sudo apt-get update && sudo apt-get install metricbeat
sudo systemctl enable metricbeat
✅ Step 2 – Enabling Metricbeat Modules: Collect What Matters
One of Metricbeat’s most powerful features is its modular system — allowing you to enable specific integrations to collect the exact metrics you need from the services you’re running.
Rather than manually crafting metric collection logic for each application or service, Metricbeat lets you plug in ready-made modules that:
- Know where to find the metrics
- Speak the right protocols
- Parse and format the data for Elasticsearch
- Automatically load prebuilt dashboards in Kibana
Each module includes:
- One or more metricsets (types of metrics to collect)
- A sample configuration file
- Optional prebuilt Kibana dashboards
📊Commonly Used Metricbeat Modules:
| Module | What it Monitors | Typical Use Case |
|---|---|---|
| system | CPU, memory, disk, load, processes, uptime | Monitor overall server health |
| apache | Requests/sec, connections, workers, error counts | Track web server performance |
| mysql | Queries/sec, slow queries, connections, cache stats | Gain visibility into database performance |
| nginx | Same as Apache but for NGINX | Use if your app runs on NGINX |
| docker | Container stats, CPU/mem per container | If using Docker to run your stack |
| kubernetes | Pod health, resource usage, node status | For containerized environments using K8s |
| redis | Memory usage, keys, eviction stats | Monitoring cache/storage layers |
| mongodb | Query rate, replication, memory usage | For NoSQL-based backends |
To activate a module in Metricbeat, use the following command:
sudo metricbeat modules enable system
sudo metricbeat modules enable apache
sudo metricbeat modules enable mysql
To check which modules are enabled:
metricbeat modules list
📝 Pro Tips:
- Don’t enable modules for services you’re not running — they’ll generate errors.
- If you change anything in the module
.ymlfiles, remember to restart Metricbeat. - Many modules (like MySQL or Apache) require authentication or enabling status endpoints — we’ll configure these in the next steps.
2.1 Configure Apache Module:
Edit /etc/metricbeat/modules.d/apache.yml:

Note: You must enable Apache server-status module:
sudo a2enmod status
sudo systemctl restart apache2
Update /etc/apache2/mods-enabled/status.conf to allow access from Metricbeat’s IP

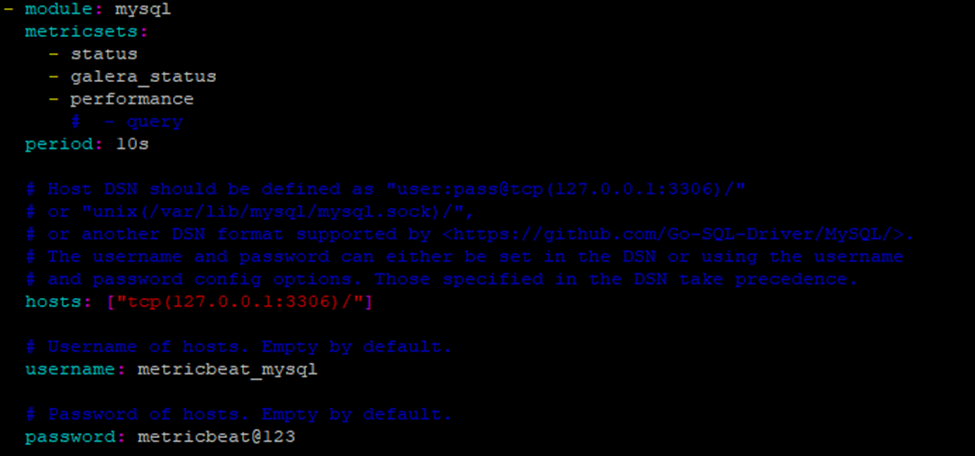
2.2 Configure MySQL Module:
– Create user for collecting metrics on mysql server:
CREATE USER 'metricbeat_mysql'@'%' IDENTIFIED BY 'metricbeat@123';
GRANT PROCESS, REPLICATION CLIENT ON *.* TO 'metricbeat_mysql'@'%';
GRANT SELECT ON performance_schema.* TO 'metricbeat_mysql'@'%';
GRANT SELECT ON mysql.* TO 'metricbeat_mysql'@'%';
GRANT SELECT ON information_schema.* TO 'metricbeat_mysql'@'%';
FLUSH PRIVILEGES;
– Edit /etc/metricbeat/modules.d/mysql.yml:
2.3 Output to Elasticsearch:
– Edit /etc/metricbeat/metricbeat.yml on app and mysql server:
output.elasticsearch:
 hosts: ["https://your-elk-server-ip:9200"]
 ssl.verification_mode: none
username: "elastic"
password: "your_elastic_password"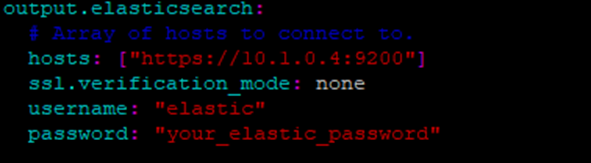
Also configure setup.kibana: if you want dashboards:
setup.kibana:
  host: "http://your-elk-server-ip:5601"
2.4 Start Metricbeat:
Enable and start:
sudo systemctl enable metricbeat
sudo systemctl start metricbeat
Set up built-in dashboards (only needed on first run):
sudo metricbeat setupII/Step-by-Step: Step 3: Visualize Real-Time Metrics in Kibana
Once Metricbeat is installed and properly configured on your web and database servers, it’s time to bring your data to life.
With just a few clicks inside Kibana, you’ll gain complete observability across your infrastructure — from low-level CPU spikes to high-level MySQL query rates.
Accessing Kibana
Open your browser and go to:
http://your-elk-server-ip:5601Login (if security is enabled), then:
- Click “Dashboard”
- Go to “Dashboard” → Search for:
- Metricbeat Apache Overview
- Metricbeat MySQL Overview
- Metricbeat System Overview
You’ll see live dashboards with:
- CPU, Memory, Disk I/O, Load Average
- Apache Requests/sec, Workers, Errors
- MySQL Connections, Slow Queries, Query Cache


✅ Conclusion: From Blind Spots to Full Visibility
By combining the power of ELK Stack with Metricbeat, you’ve just transformed your LAMP stack from a black box into a fully observable infrastructure. Now, every request hitting Apache, every slow MySQL query, and every CPU spike is tracked, visualized, and ready for action.
This monitoring setup isn’t just about pretty dashboards — it’s about confidence, reliability, and the ability to spot problems before users do.
Whether you’re running a fast-growing SaaS product or managing critical infrastructure, full-stack observability isn’t optional anymore — it’s the new normal.
And the best part? All of this was built with open-source tools, no licensing headaches, and total flexibility to scale.
🚀 Want More?
At TechNoStress, we help developers, DevOps engineers, and sysadmins build smarter, stress-free infrastructure. Check out our upcoming posts on:
- Custom Kibana dashboards for business-level metrics
- Integrating alerting with Slack, Email, or Telegram
- Using Filebeat to monitor app-level logs alongside metrics
Don’t forget to subscribe, share this post with your team, and start building infrastructure that talks back — in real-time.

🔍 Want to go beyond metrics? Learn how to analyze SSH logs like a pro using the full ELK Stack


I don’t even know how I ended up here, but I thought this post was great.
I do not know who you are but certainly you are
going to a famous blogger if you aren’t already 😉 Cheers!
This website is my intake, real fantastic style and perfect content.