Monitoring SSH login activity is essential for detecting unauthorized access, brute-force attacks, and suspicious login behavior. In this technical walkthrough, we’ll demonstrate how to use Elasticsearch 8, Logstash, and Kibana to analyze SSHD logs from Linux servers and visualize them through interactive dashboards.
You can download the sample SSHD log file used in this demo from the following GitHub repository:
Part 1: Introduction to Elasticsearch 8 for Log Analytics
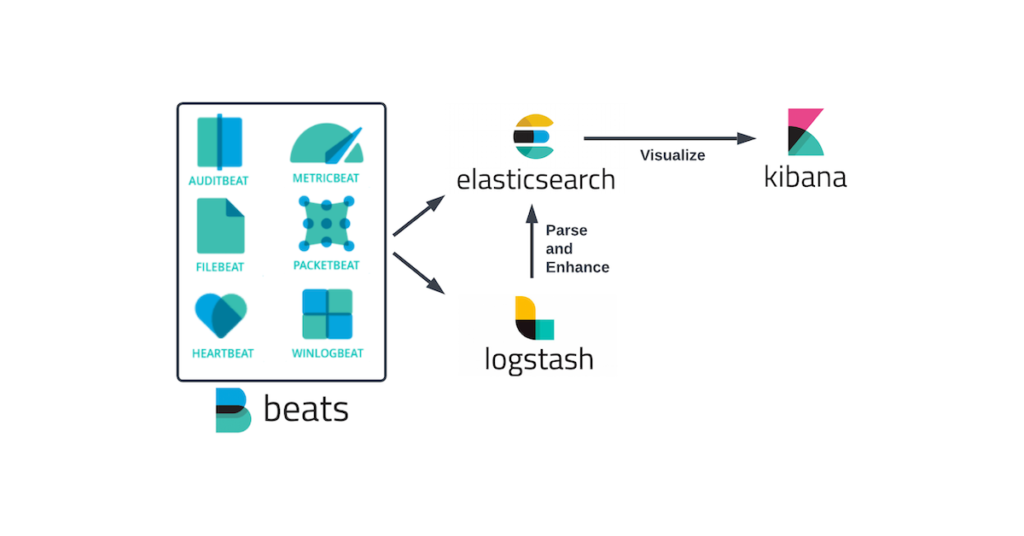
– Elasticsearch is a distributed, RESTful search and analytics engine. It is the core component of the ELK Stack (Elasticsearch, Logstash, Kibana), providing powerful indexing and querying capabilities for large volumes of data.
– Key Functions of Elasticsearch
- Indexes and stores large volumes of logs in near real-time
- Supports structured and unstructured log data
- Enables full-text search with powerful filters
- Horizontally scalable through sharding and clustering
– Real-World Applications
- Centralized logging for applications and servers (e.g., syslog, Apache, Nginx, SSHD)
- Security analytics and SIEM platforms
- Performance monitoring and behavioral analysis
In this project, Elasticsearch acts as the searchable database for enriched and parsed SSH logs collected from multiple Linux servers.
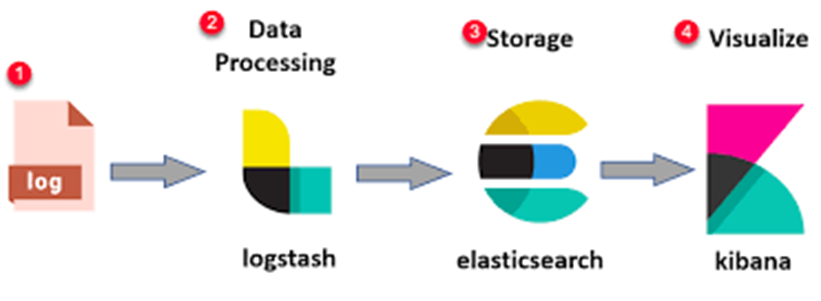
Part 2: Logstash – Ingest, Parse, and Enrich SSH Logs
– Logstash is a dynamic data collection pipeline that ingests, transforms, and sends logs to Elasticsearch. It supports flexible filters and plugins, enabling enrichment of raw data into structured documents.
– Logstash Pipeline Structure
- Input: Read SSHD logs from the Linux system
- Filter: Extract fields, normalize data, and enrich IPs using GeoIP
- Output: Push structured documents to Elasticsearch
– Logstash Configuration Example (Line-by-Line Explanation)
input {
  file {
    path => /root/log_example/sshd_logs_Q1_2025.log"   # Path to your SSHD log file
    start_position => "beginning"              # Begin reading from the top of the file
    sincedb_path => "/dev/null"                # Prevents Logstash from remembering read position
    tags => ["sshd"]                            # Tag for conditional processing
  }
}

filter {
  if "sshd" in [tags] {
    grok {
      match => {
        "message" => [
          "%{SYSLOGTIMESTAMP:timestamp} %{HOSTNAME:host} sshd\[%{NUMBER:pid}\]: %{WORD:auth_status} %{WORD:auth_method} for %{USERNAME:user} from %{IP:ip} port %{INT:port} ssh2",
          "%{SYSLOGTIMESTAMP:timestamp} %{HOSTNAME:host} sshd\[%{NUMBER:pid}\]: Invalid user %{USERNAME:user} from %{IP:ip} port %{INT:port}"
        ]                                        # Two Grok patterns for different SSH log types
      }
    }

    mutate {
      lowercase => ["auth_status", "auth_method", "user"]  # Normalize case of extracted fields
    }

    date {
      match => ["timestamp", "MMM  d HH:mm:ss", "MMM dd HH:mm:ss"]  # Parse log timestamp
      target => "@timestamp"                                          # Standard timestamp field
    }

    geoip {
      source => "ip"                                               # Enrich IP field with GeoIP
      ecs_compatibility => disabled
    }
  }
}

output {
  if "sshd" in [tags] {
    elasticsearch {
      hosts => ["http://localhost:9200"]
      index => "sshd-logs-%{+YYYY.MM.dd}"              # Daily index for SSHD logs
    }
    stdout { codec => rubydebug }                      # Debug output to console
  }
}
– Running Logstash to Import the SSHD Demo File
- Save the above configuration into a file named
logstash_sshd.conf - Ensure the sample SSHD log file (e.g.,
sshd_logs_2024.log) is available and the path is correctly set in thepathfield - Run the following command to start Logstash and ingest logs:
sudo /usr/share/logstash/bin/logstash -f /root/log_example/logstash_sshd.conf
You should see parsed logs in the console (thanks to stdout { codec => rubydebug }) and indexed documents in Elasticsearch under index names like sshd-logs-2024.01.01, sshd-logs-2024.01.02, etc.
✅ Core Filters Explained
- Grok: Pattern-matching to extract fields from raw logs
- GeoIP: Adds geographical info (country, city, coordinates) from IPs
- Mutate: Formats and normalizes field values
- Date: Converts timestamps to
@timestampfor accurate time-based querying
Part 3: Installing Elasticsearch, Kibana, and Logstash on Ubuntu
Before analyzing logs, we must first install the ELK Stack components on your Ubuntu server.
Step 1: Install Java (required)
sudo apt updatesudo apt install -y openjdk-17-jdkStep 2: Add Elastic GPG Key and Repository
wget -qO - https://artifacts.elastic.co/GPG-KEY-elasticsearch | sudo apt-key add -echo "deb https://artifacts.elastic.co/packages/8.x/apt stable main" | sudo tee /etc/apt/sources.list.d/elastic-8.x.listsudo apt updateStep 3: Install Elasticsearch
sudo apt install -y elasticsearchEnable and start the service:
sudo systemctl enable elasticsearchsudo systemctl start elasticsearchStep 4: Install Kibana
sudo apt install -y kibanaEnable and start Kibana:
sudo systemctl enable kibanasudo systemctl start kibanaStep 5: Install Logstash
sudo apt install -y logstash✅ Access Kibana
– Open your browser and navigate to:
http://localhost:5601– If you’re accessing a remote server, replace localhost with the IP or domain. Now you’re ready to start indexing logs into Elasticsearch and building dashboards in Kibana!
Part 4: Demo Visualizing SSH Login Behavior with Kibana
– Kibana is the visualization tool in the ELK Stack. It allows you to build real-time dashboards and query logs interactively.
Step-by-Step: Setting up Kibana for SSHD Log Analysis
This section walks you through building two essential dashboards:
Dashboard : SSH Login Overview Dashboard
Includes:
- Successful vs Failed logins over time
- Top IPs attempting login
- Top SSH usernames
- Geo-distribution of login sources
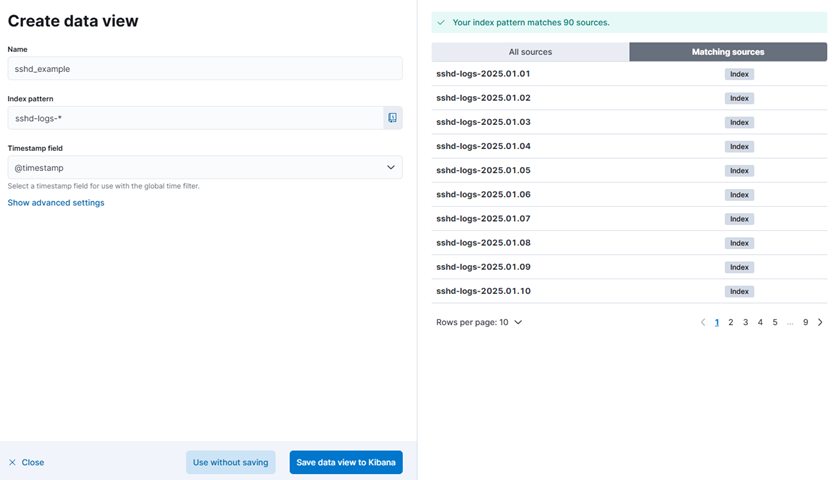
Step 1: Create an Index Pattern
- Go to Analytics > Discover > Create Data View
- Enter the pattern sshd-logs-*.
- Choose @timestamp as the time filter field.
- Click Save data view to Kibana
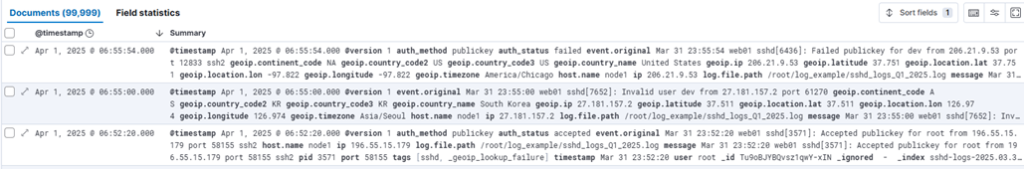
Step 2: Explore Data in Discover
- Go to Analytics > Discover again
- Select the newly created data view sshd_example and set the time range to display documents from one year ago to the present.

- Now we analyze documents inserted into Elasticsearch, which have been enriched by Logstash. From the original log source, Logstash parses and extracts structured fields such as timestamp, ip, hostname, username, auth_method (e.g., publickey or password), and auth_status (Accepted or Failed).
What makes Logstash especially powerful is its ability to enhance the ip field using the geoip filter, automatically adding geographic context such as geoip.continent_code, geoip.country_name, geoip.latitude, and geoip.longitude. This level of enrichment is one of Logstash’s standout features in log analysis workflows.
Step 3: Create Visualizations for SSH Login Overview Dashboard
– Configure the time filter in Kibana to display security event data from the last 30 days, ensuring up-to-date visibility for SOC monitoring dashboards.

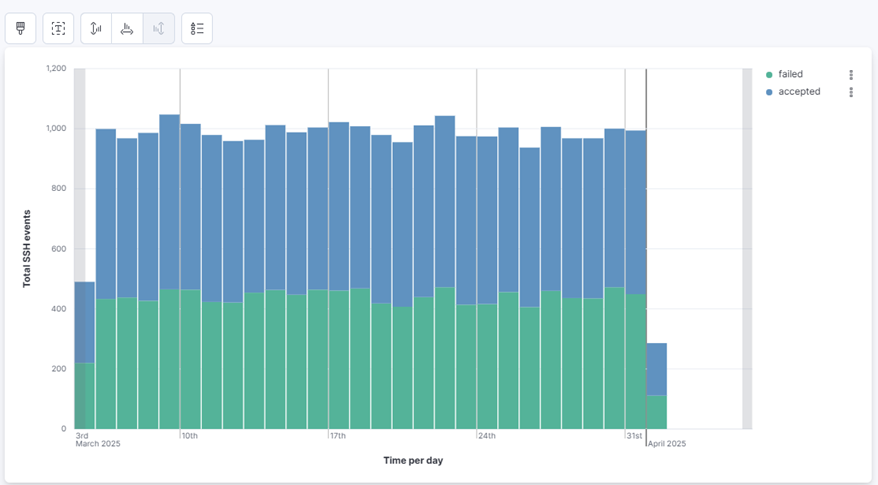
1. Successful vs Failed Login Attempts (Time Series):
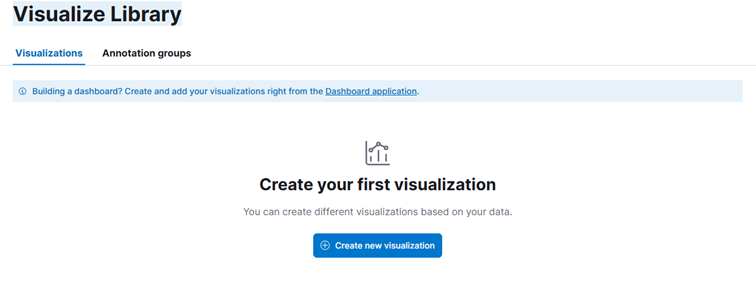
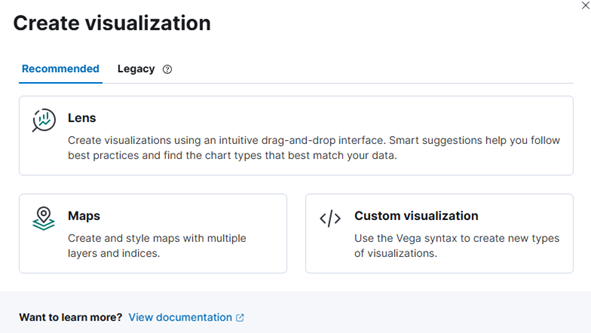
- Go to Visualize Library > Create new visualization > Lens.
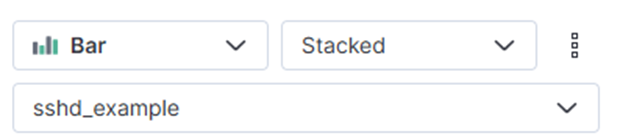
- Choose Bar chart and data view sshd_example
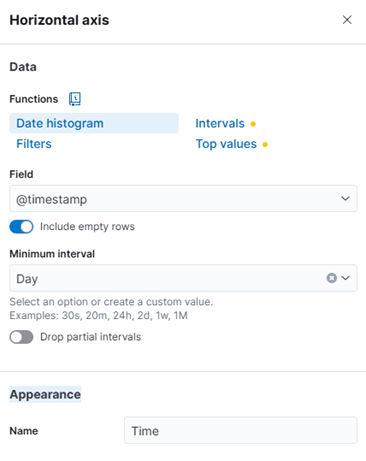
- Add @timestamp to Horizontal axis. Minimum interval choose day. Appearance re-labeling to Time
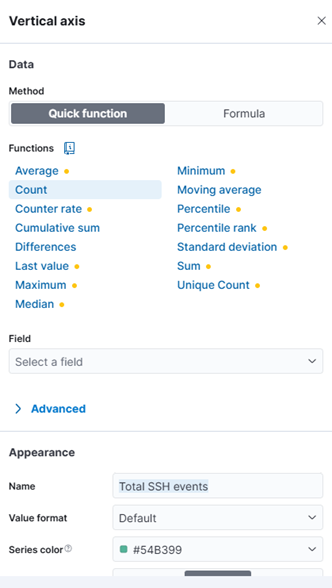
- Add Count (meaning total of events ssh in a day) to Vertical axis. Appearance re-labeling to Total SSH events
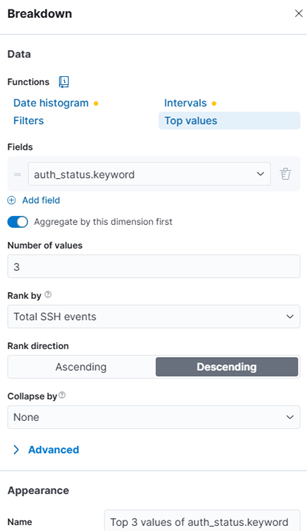
- Add auth_status.keyword to Breakdown
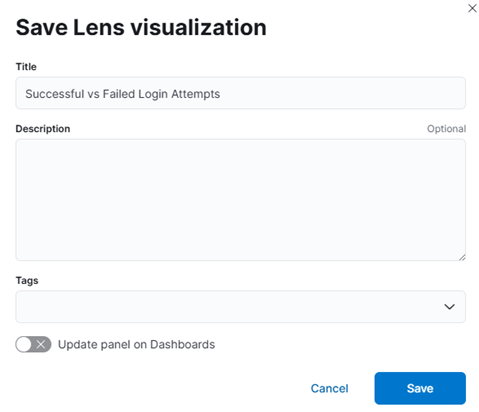
- After completing the above steps, you will have a visualization displaying the login status distribution. Click ‘Save’ and name it Successful vs Failed Login Attempts.
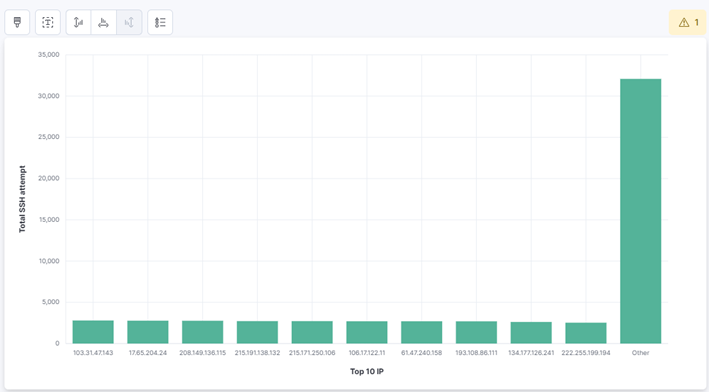
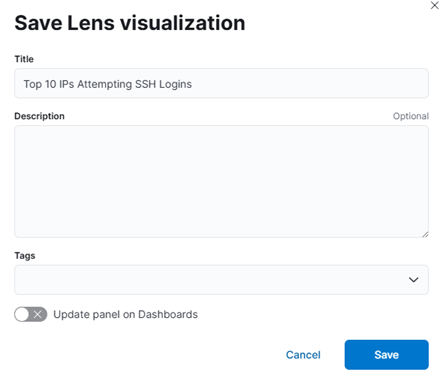
2. Top 10 IPs Attempting SSH Logins:
- Choose Bar chart and data view sshd_example
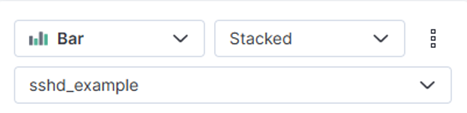
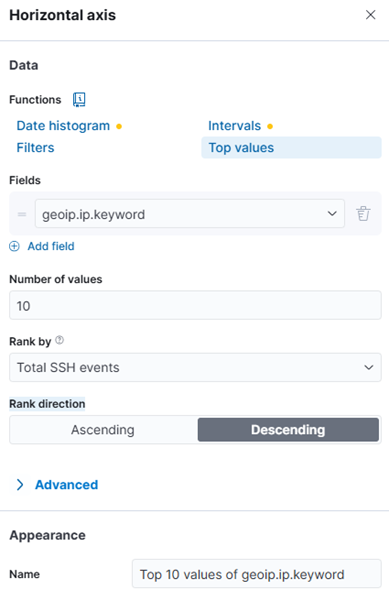
- Add ip.keyword to Horizontal axis. Rank direction > Descending. Appearance re-labeling to Top 10 IP
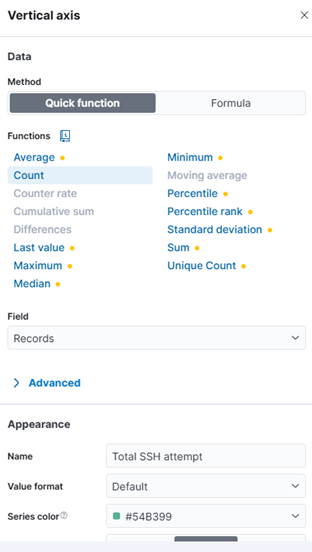
- Add Count (meaning total of events ssh in a day) to Vertical axis. Appearance re-labeling to Total SSH attempt
- Once you’ve completed the steps above, you will see a chart displaying the top 10 IP addresses with the highest number of SSH login attempts in the past month. Save this visualization with the name Top 10 IPs Attempting SSH Logins.
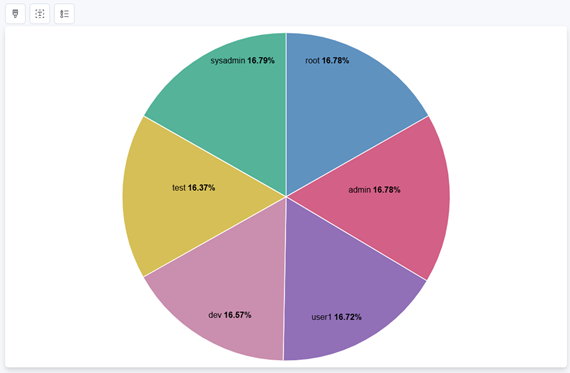
3. Most Active SSH Usernames:
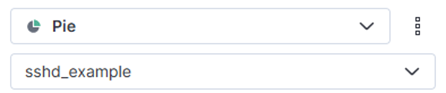
- Choose Pie chart and data view sshd_example
- Configure slice by field user.keyword to Horizontal axis. Sort descending, Top 10. Appearance re-labeling to Top 10 Username For Login
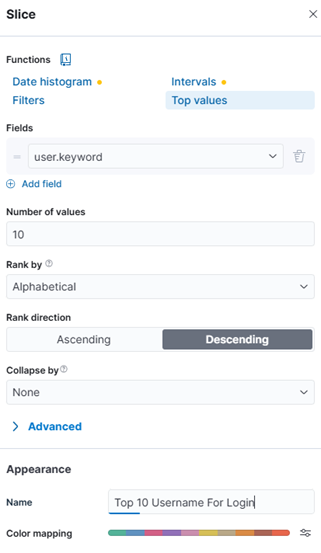
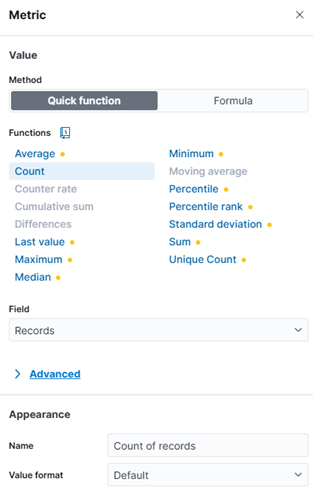
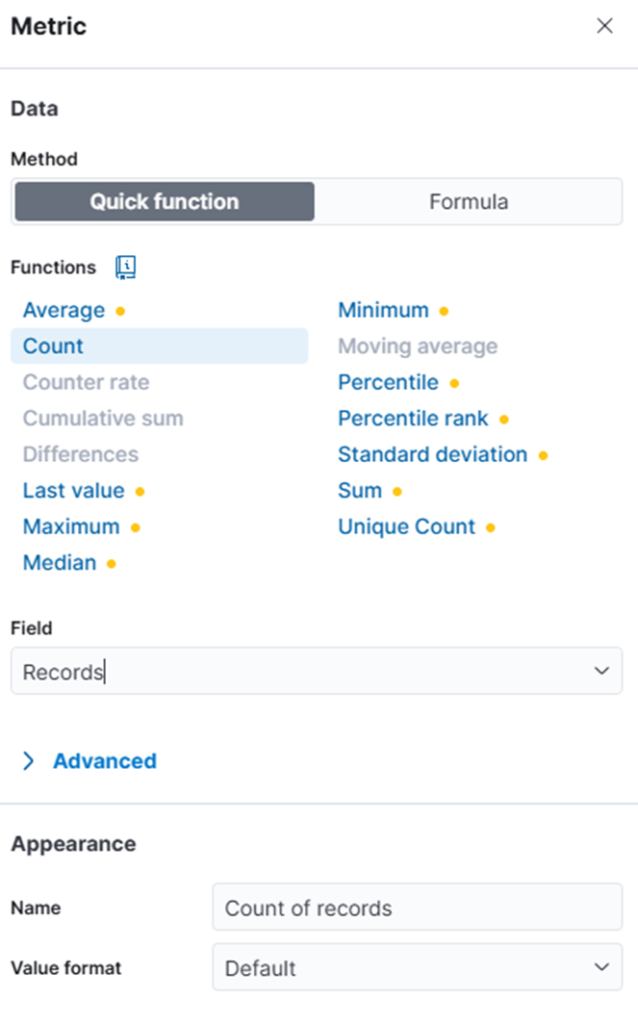
- Add function Count to Metric
- After completing the steps above, you will have a visualization showing the top 10 usernames used in SSH authentication events over the past month, along with the percentage distribution for each username. This helps SOC analysts identify high-frequency accounts and potential targets of abuse or misuse. Save this visualization with the name Most Active SSH Usernames
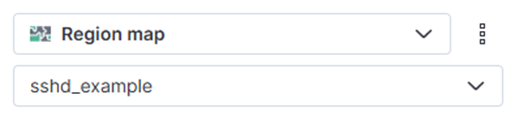
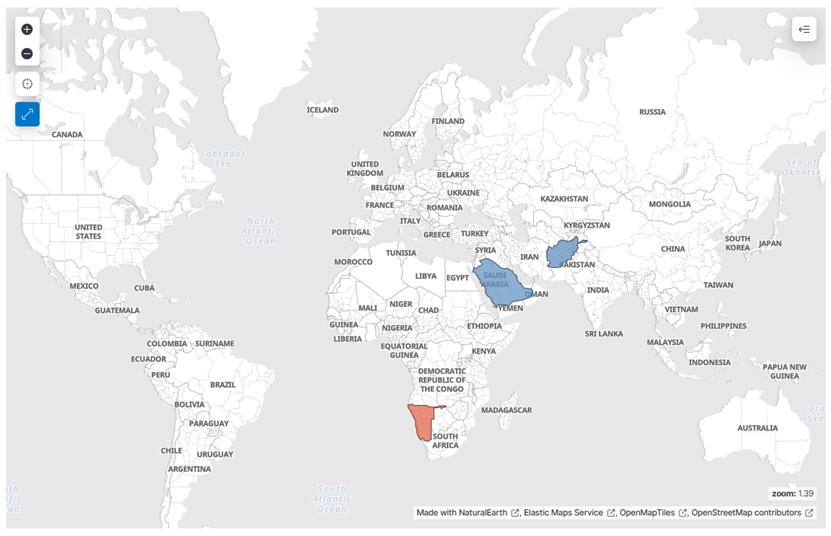
4. Geo Map of Login Origins:
- Choose Region map chart and data view sshd_example
- Add field geoip.continent_code.keyword to Region key. Sort descending, Top 30
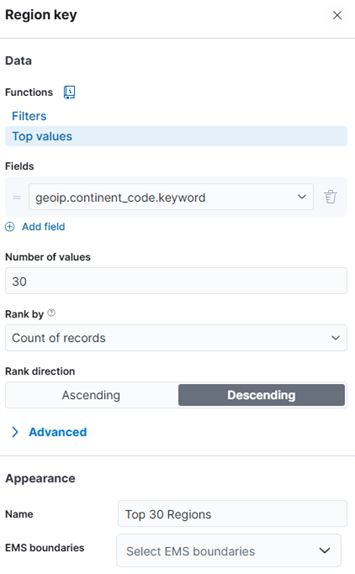
- Add function Count to Metric
- Upon completing the steps above, you’ll generate a geolocation map highlighting the top 30 countries with the highest volume of SSH login activity over the past month. This visualization supports SOC operations by revealing geographic patterns that may indicate targeted attacks or abnormal access behavior. Save this visualization with the name Geo Map of Login Origins
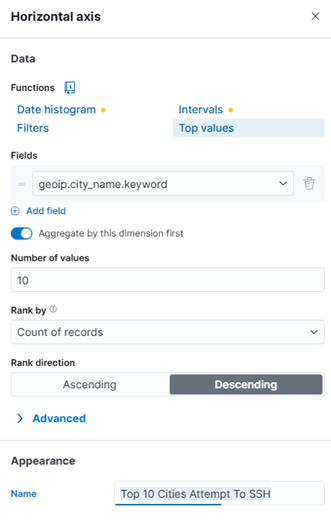
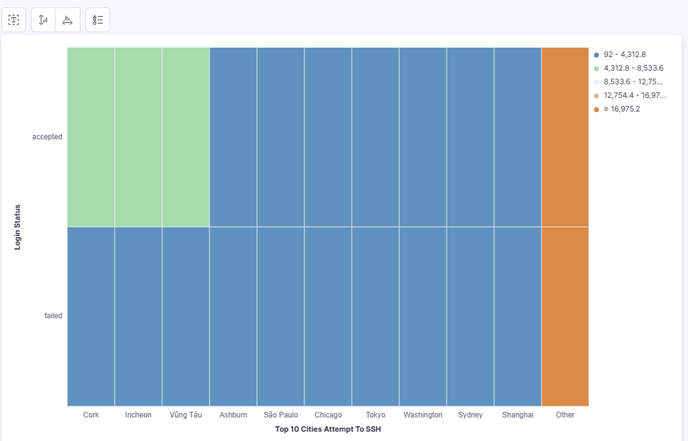
5. Top 10 Cities With Most SSH Access Attempts:
- Add field geoip.city_name.keyword to Horizontal axis. Choose top 10 and Rank direction Descending. Appearance re-labeling to Top 10 Cities Attempt To SSH
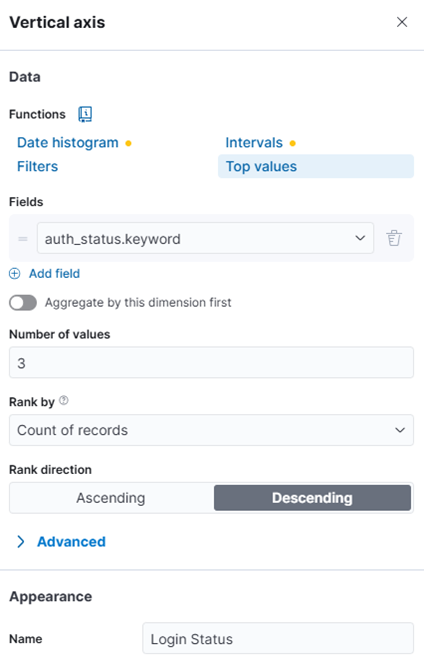
- Add field auth_status.keyword to Vertical axis and Function choose Top values. Rank direction choose Descending. Appearance re-labeling to Login Status
- Cell value choose function Count
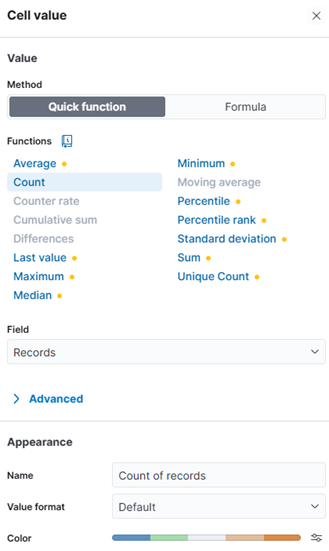
- After completing these steps, you will have a visualization displaying the top 10 cities with the highest number of SSH login attempts. The chart also breaks down each city’s activity by login outcome—successful or failed—providing deeper insight into geographic access patterns and potential attack vectors. Save this visualization with the name Top 10 Cities With Most SSH Access Attempts.
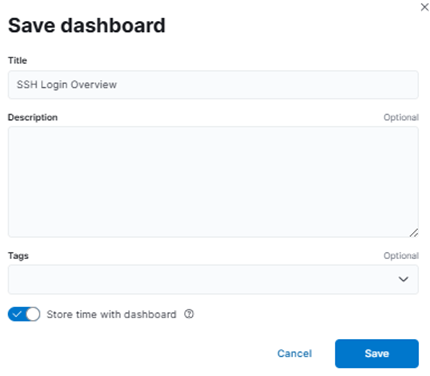
Step 4: Build the SSH Login Overview Dashboard
- Go to Analytics > Dashboard → Create a dashboard.
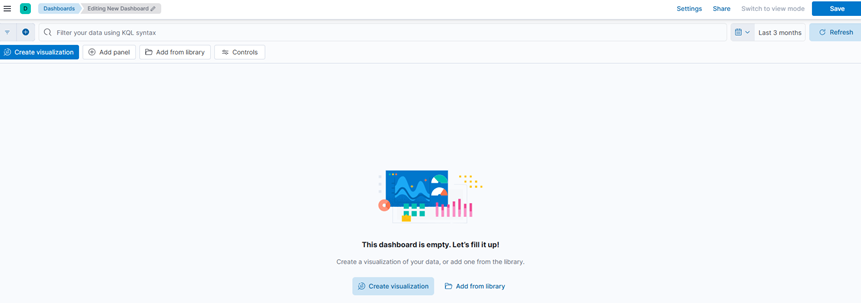
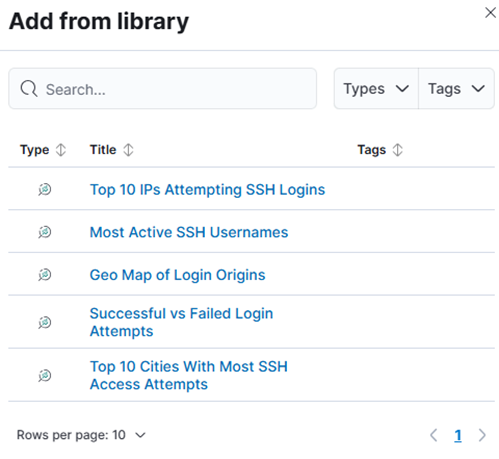
- Click Add from library > Add the 5 visualizations above.
- Resize and organize clearly.
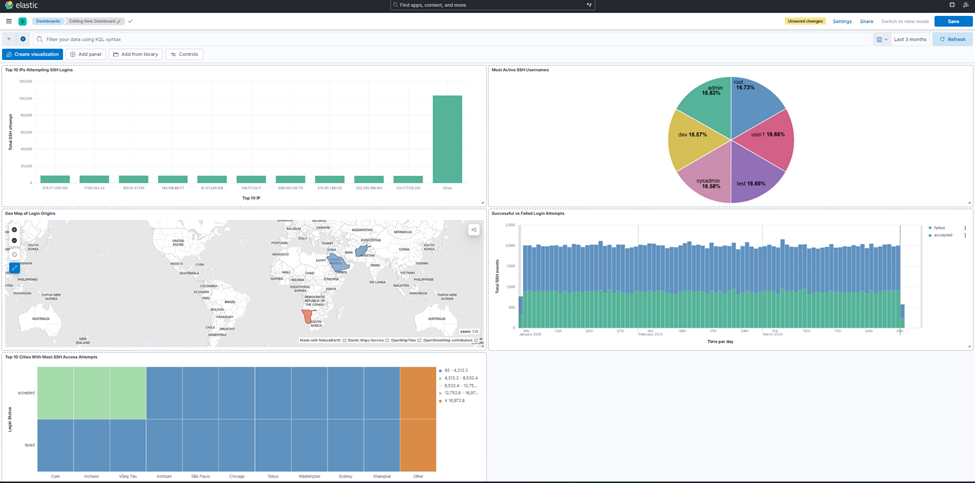
- Save the dashboard as SSH Login Overview.
Turn boring SSH logs into security intelligence that matters.