I. What is Ollama — and Why It’s Perfect for Local AI Experiments
It all started one late night when I was scanning through a pile of Linux system logs — endless lines of messages streaming down my terminal.
One server showed a random reboot, another kept throwing 500 errors, and somewhere deep inside, there were kernel warnings that didn’t look friendly at all.
I remember thinking:
“If only something could read these logs for me — understand them like a real engineer.”

At that moment, I wasn’t looking for another dashboard or alert rule.
I wanted something that could actually comprehend what was happening — a system that could connect dots between “OOM killer” messages, “dmesg I/O errors,” and “API latency spikes.”
But there was a catch: I couldn’t send these sensitive logs to any cloud AI model.
They contained hostnames, IP addresses, process names — private infrastructure details.
So the question became:
Can I run a powerful language model locally, on my own server, without depending on the cloud?
That’s when I discovered Ollama.
🧠Ollama — The Local LLM Engine You’ll Actually Enjoy Using
Setting up an AI model used to be painful: huge downloads, CUDA versions mismatched, dependencies breaking halfway through.
But Ollama changes that story completely.
Ollama is like the Docker for LLMs — a lightweight engine that lets you pull and run AI models locally.
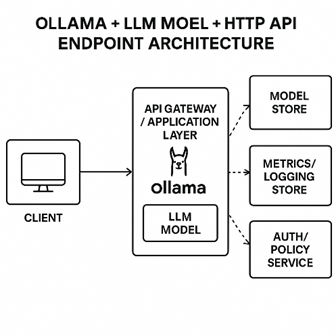
Once installed, it manages everything: model downloads, memory, inference, and an HTTP endpoint compatible with the OpenAI API.
On my Ubuntu server, setup took less than 5 minutes:
curl -fsSL https://ollama.com/install.sh | sh
ollama pull gemma
ollama run gemma
And just like that, I had my own private AI running at http://localhost:11434.
No tokens. No cloud. No privacy concerns.
It felt like magic — but with sysadmin simplicity.
🚀Why System Engineers Love Ollama
For system admins and DevOps engineers, the two biggest headaches when working with AI are data security and deployment complexity.
Ollama solves both beautifully.
- 🧩 Privacy by design: Everything runs locally. Logs never leave your server.
- ⚙️ Simple deployment: No need for GPU clusters or MLOps pipelines.
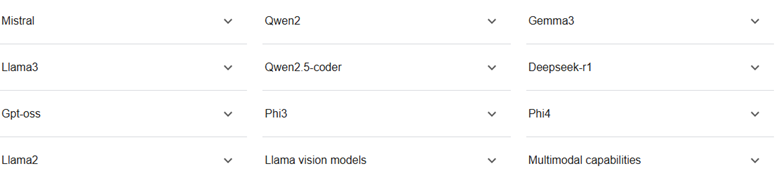
- 🧠 Open ecosystem: Supports popular open-source models — Gemma, LLaMA 3, Mistral, Phi-3, Command R+, and many more.
- 🔌 Developer-friendly API: Compatible with the OpenAI
chat/completionsformat, so any existing Python code can talk to it easily.
This made it a natural fit for my experiment — a local AI co-pilot that could help analyze system logs every day.
🖥️Popular LLM models supported by Ollama:
🌐Meet Gemma — Google’s Compact, Sharp, and Reliable Model
Among all open-source models, Gemma stood out to me.
It’s light enough to run on a single Ubuntu box but powerful enough to understand technical logs and reasoning chains.
Gemma is designed with three principles in mind:
- Efficiency — It runs well even without high-end GPUs.
- Accuracy — It produces grounded, factual analysis.
- Adaptability — It can be fine-tuned or prompted for different technical use cases.
When I first ran Gemma on Ollama, I asked it a simple question:
“Please summarize what might be wrong in this log snippet.”
To my surprise, it didn’t just describe the errors — it reasoned through them.
It pointed out an OOM killer event, linked it to MySQL memory usage, and even suggested reducing the InnoDB buffer pool size.
That was the moment I realized this wasn’t just another chatbot — it was a new kind of system assistant.
II. Why Use LLMs for Log Analysis
If you’ve ever worked as a system admin, you know the daily routine:
logs, alerts, dashboards, repeat.
A user complains about “the system being slow.”
You open Grafana — CPU looks fine.
You check /var/log/syslog, scroll for minutes, then jump to dmesg.
Now there’s a flood of kernel messages, and you’re not sure which one really matters.
And that’s when you realize: it’s not that we don’t have enough data — it’s that we have too much.
🧩The Pain of Traditional Log Analysis
Most teams use a mix of tools — Splunk, ELK Stack, Prometheus, or plain rsyslog.
These are great at collecting data, indexing it, and showing graphs.
But they don’t understand what they’re seeing.
A regex can tell you that the string “error” appears 50 times.
But it won’t tell you why your node rebooted, or how a kernel panic links to your database crash.
That’s where LLMs come in.
Large Language Models — like Gemma — don’t just parse text; they comprehend context.
They can read through thousands of lines of mixed logs, recognize event patterns, and even hypothesize causal relationships.
In other words, they think more like a senior engineer than a parser.
🧩How LLMs Think Differently
Let’s say your system logs look like this:
May 09 01:23:11 db-node kernel: Out of memory: Kill process 8432 (mysqld)
May 09 01:23:12 db-node systemd: mysqld.service: Main process exited, code=killed
May 09 01:23:20 api-node nginx[4312]: 502 Bad Gateway
May 09 01:23:25 load-balancer haproxy[1223]: backend 'api' has no server available
A traditional log search tool might just flag “error” and “OOM killer.”
But Gemma, through Ollama, connects the dots:
“The MySQL process was terminated by the kernel OOM killer due to memory exhaustion, causing the API node to fail database connections, which in turn triggered 502 errors and load balancer unavailability.”
That’s reasoning — not pattern matching.
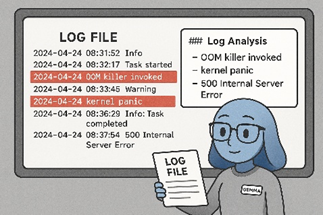
📊When AI Becomes Your Log Analyst
In our project, Gemma acts as a digital log analyst.
Every night, it reviews logs from multiple sources:
syslog,journalctl,dmesg- Nginx, MySQL, Docker, Kubernetes
- Security events (failed SSH logins, sudo attempts)
It doesn’t just summarize — it classifies problems:
- Security
- Hardware
- OS/Kernel
- Application
- Performance/Resource
- Network
- Configuration
Then it assigns a severity (Low / Medium / High / Critical) and provides:
- Evidence lines from logs
- Root cause reasoning
- Step-by-step remediation
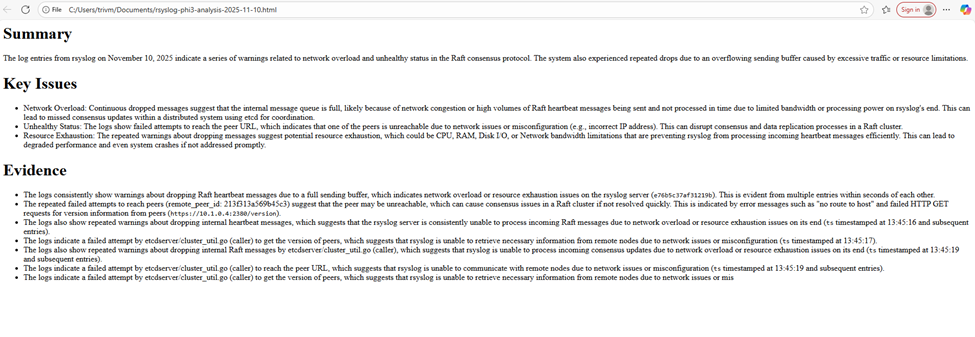
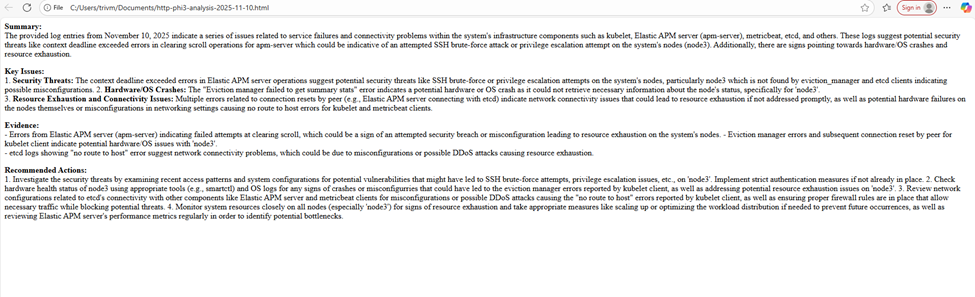
Imagine coming to work and opening a neat HTML report saying:
🟠 High severity – Memory exhaustion detected
Kernel OOM killer terminated mysqld.
System RAM usage reached 97% due to unoptimized buffer pool configuration.
🧠 Recommendation:
Reduce innodb_buffer_pool_size to 70% of available RAM, enable swap, and monitor with vmstat.
That’s the kind of context-aware insight no regex can ever give you.
💡Beyond Detection: LLMs Can Suggest Action
One of the most surprising parts of using LLMs for this job is their ability to propose real remediation steps.
Instead of just saying “disk error detected,”
Gemma can say something like:
“SMART warning indicates potential disk failure on /dev/sda.
Run smartctl -a /dev/sda to confirm, and schedule replacement within 48 hours.”
Or when a brute-force attempt is detected:
“Multiple failed SSH logins detected from IP 103.221.45.12.
Recommend adding to /etc/hosts.deny or blocking via UFW:sudo ufw deny from 103.221.45.12.”
These are not hallucinations — they’re concrete, verifiable actions drawn from years of sysadmin best practices embedded within the model’s training.
III. Architecture Overview — How the Pieces Work Together
When I first started this project, I wanted something simple, modular, and explainable.
No fancy AI cloud setup, no pipelines that take days to configure — just something that any sysadmin could deploy in a few hours on an Ubuntu box.
The idea was to build an AI-powered log analyst, sitting quietly inside your network, reading logs from all your servers every day, and producing a concise report about what happened.
Here’s the big picture of how everything connects:
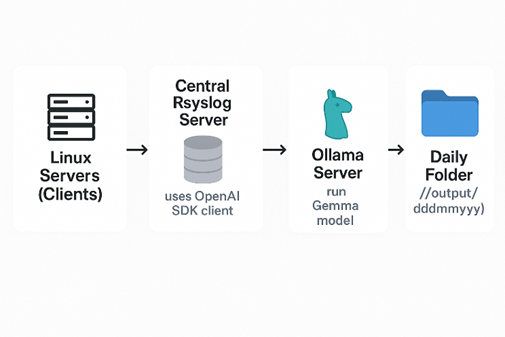
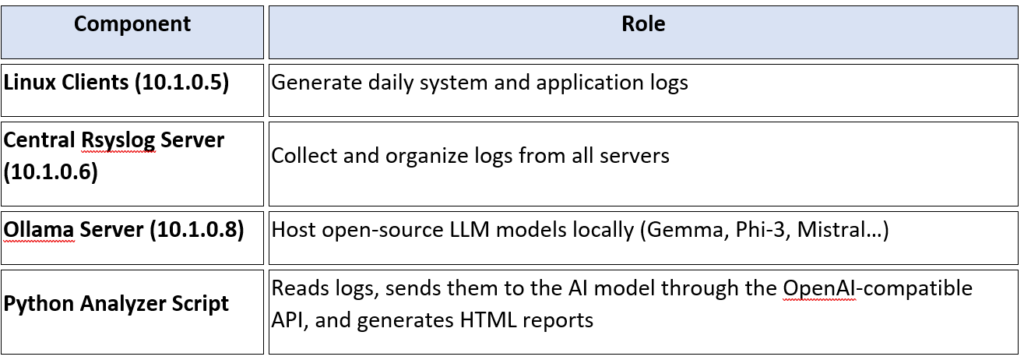
Before diving into the detailed setup, let’s take a moment to look at the small but powerful demo environment behind this project.
Everything runs inside a local lab network — no cloud, no external API calls, just pure on-prem AI at work.
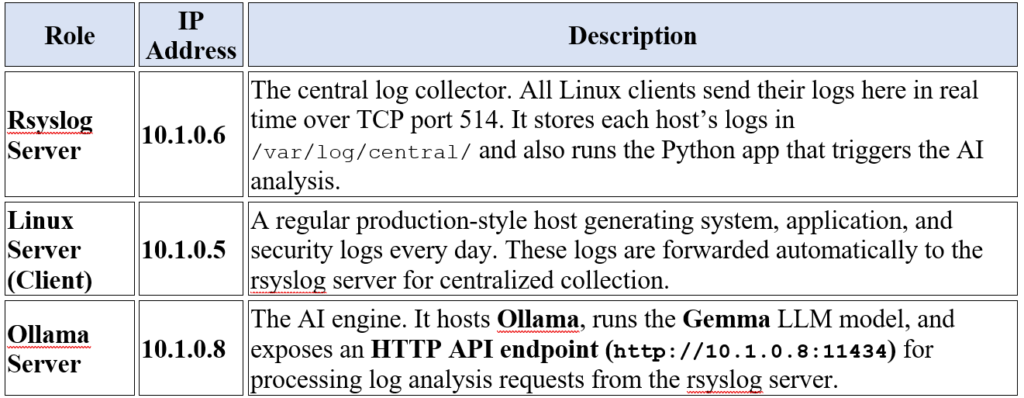
There are three main servers, each with a distinct role:
Step 1: Setting up the Central Rsyslog Server (10.1.0.6)
We’ll start by preparing one Ubuntu server to act as our log collector — the central place where all Linux servers send their system logs.
1. Install and enable rsyslog
Most Ubuntu systems already have it installed. Just make sure it’s enabled and ready for remote input.
sudo apt update
sudo apt install rsyslog -y
sudo systemctl enable rsyslog
sudo systemctl start rsyslog
Check that the service is running:
sudo systemctl status rsyslog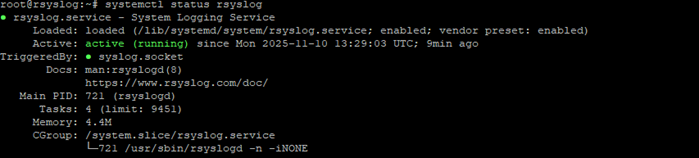
2. Enable TCP log reception
Edit /etc/rsyslog.conf and ensure these lines are present and uncommented:
module(load="imtcp")
input(type="imtcp" port="514")
This allows the server to listen for incoming logs on port 514/TCP.
Restart rsyslog:
sudo systemctl restart rsyslogYou can confirm the port is open:
sudo netstat -tulnp | grep 514
3. Create a custom template for incoming logs
At the bottom of /etc/rsyslog.conf, add:
$template DailyLogs,"/var/log/central/%HOSTNAME%-%$YEAR%-%$MONTH%-%$DAY%.log"
*.* ?DailyLogs
& ~
This creates individual log files per host, per day — for example:
/var/log/central/web01-2025-11-09.log
/var/log/central/db01-2025-11-09.log
Then create the log directory:
sudo mkdir -p /var/log/central
sudo chown syslog:adm /var/log/central
Restart rsyslog again:
sudo systemctl restart rsyslogNow the rsyslog server is ready to collect logs from multiple machines.
Step 2: Configuring the Linux Client (10.1.0.5)
Now, let’s make the client machine forward all its logs to the rsyslog server.
Step 2.1: Edit the configuration
Open the rsyslog config on the client:
sudo nano /etc/rsyslog.confScroll to the bottom and add:
*.* @@10.1.0.6:514*.*means “send all logs.”@@means “use TCP protocol.”
Restart rsyslog:
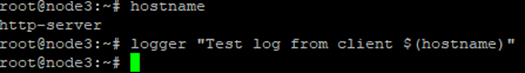
sudo systemctl restart rsyslogTest if it works:
logger"Test log from client $(hostname)"
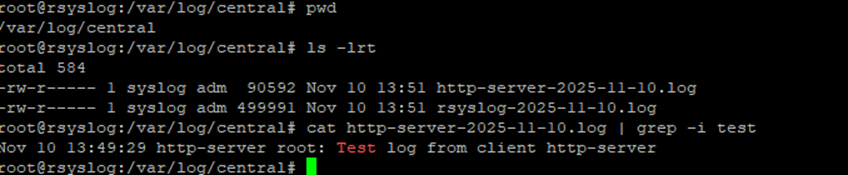
Then on the rsyslog server, check:
cat http-server-2025-11-10.log | grep -i test
You should see that message appear almost instantly.
Step 3: Deploying Ollama and Gemma (10.1.0.8)
This server is your AI engine.
It runs Ollama — a lightweight runtime for local LLM inference — and the Gemma model from Google.
Step 3.1: Install Ollama
curl -fsSL https://ollama.com/install.sh | shVerify installation:
ollama --version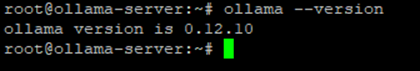
Start Ollama as a service:
sudo systemctlenableollamasudo systemctl start ollama
Step 3.2: Pull and Run the Gemma Model
ollama pull gemmaollama run gemmaThis will download the model and make it ready for API requests.

Ollama listens on:
http://localhost:11434If the rsyslog server (10.1.0.6) will connect remotely, update Ollama’s configuration file to allow external access.
Edit /etc/systemd/system/ollama.service and add this line under [Service]:
Environment="OLLAMA_HOST=0.0.0.0"
Then reload:
sudo systemctl daemon-reload
sudo systemctl restart ollama
Now, the endpoint becomes:
http://10.1.0.8:11434
Step 4: Creating the Python Analyzer on Rsyslog Server (10.1.0.6)
Now comes the automation.
This Python script will:
- Read today’s logs from
/var/log/central/ - Build a prompt with analysis instructions
- Send the prompt to Gemma on
10.1.0.8 - Save the AI-generated Markdown report as HTML
Step 4.1: Install dependencies
sudo apt install python3-pip -y
pip install requests markdown
pip install -U "openai>=1.2.0,<1.20" "httpx>=0.23,<0.27"
pip install -U requests urllib3 chardet
pip install openai
Step 4.2: Create the analyzer script
Save as /root/log_analyzer.py
import os
import datetime
import markdown
from openai import OpenAI

# ========================================
# Ollama API configuration
# ========================================
OLLAMA_BASE_URL = "http://10.1.0.8:11434/v1"
OLLAMA_API_KEY = "ollama"   # placeholder - Ollama doesn't require auth
OLLAMA_MODEL = "gemma"

# Initialize OpenAI client
client = OpenAI(
    base_url=OLLAMA_BASE_URL,
    api_key=OLLAMA_API_KEY
)

# ========================================
# Directory setup
# ========================================
LOG_DIR = "/var/log/central"
TODAY = datetime.datetime.now().strftime("%Y-%m-%d")
OUTPUT_DIR = f"/output/{TODAY.replace('-', '')}"
os.makedirs(OUTPUT_DIR, exist_ok=True)

# ========================================
# Process each log file
# ========================================
for logfile in os.listdir(LOG_DIR):
    if logfile.endswith(f"{TODAY}.log"):
        hostname = logfile.split('-')[0]
        print(f"Analyzing {logfile}...")

        with open(os.path.join(LOG_DIR, logfile)) as f:
            logs = f.read()[:8000]  # truncate long logs for demo

        system_prompt = """You are an AI analyst for system reliability and security.
You analyze Linux/Windows server logs to detect:
1. Security threats (brute-force, privilege escalation, malware IOCs)
2. Hardware/OS/Application crashes
3. Resource exhaustion (CPU, RAM, disk, network)
4. Configuration or performance anomalies.

Output in Markdown with:
1. **Summary of Findings**
2. **Classification & Severity**
3. **Evidence & Analysis**
4. **Recommendations**
5. **Follow-up Checks**
"""

        user_prompt = f"Analyze the following logs from {hostname} ({TODAY}):\n\n{logs}"

        # Send to Ollama (OpenAI-compatible API)
        response = client.chat.completions.create(
            model=OLLAMA_MODEL,
            messages=[
                {"role": "system", "content": system_prompt},
                {"role": "user", "content": user_prompt},
            ],
            temperature=0.2,
        )

        result_md = response.choices[0].message.content
        html = markdown.markdown(result_md)

        output_path = f"{OUTPUT_DIR}/{hostname}-analysis-{TODAY}.html"
        with open(output_path, "w") as f:
            f.write(html)

        print(f"✅ Report saved: {output_path}")
Step 4.3: Schedule Daily Automation
Edit crontab:
sudo crontab -eAdd:
00* * */usr/bin/python3 /root/log_analyzer.py
This will run the analyzer every midnight.
Reports will be saved in /output/<date>/ automatically.
Step 5: Reviewing Daily Reports
Each morning, you can open the HTML reports in any browser:
/output/20251109/web01-analysis-20251109.html
/output/20251109/db01-analysis-20251109.html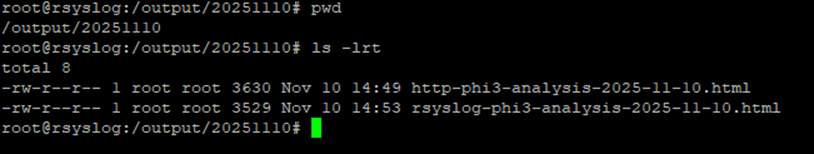
They look like concise AI-generated summaries with sections like:
IV. Conclusion — What We Built and How to Expand It in the Real World
When I first started this small experiment, the goal was simple:
💭 Could an open-source AI model help me understand system logs faster than I could by hand?
A few days later, it turned into something more powerful —
a fully automated AI-driven log analysis system that runs quietly in the background, every night, turning raw machine noise into human-readable insight.
Let’s recap what we’ve actually built.
🧩 1. What We Implemented
Over the last few sections, we created an end-to-end architecture that combines traditional system tools with modern AI reasoning:
Every midnight, the Python app picks up fresh logs, builds a structured prompt, and sends it to the LLM.
The AI model analyzes the data — identifying anomalies, security threats, or resource issues — and produces a Markdown report, which is then converted to HTML. The result:
Each morning, your /output folder contains clear, concise summaries of system health for every host.
No cloud dependencies, no data exposure, no subscriptions — just your own AI analyst running inside your infrastructure.
🧠 2. Why It Matters
By using open-source models with Ollama, we achieved something that was once only possible with commercial APIs:
- Local inference — All analysis happens inside your data center; logs never leave your network.
- Cost efficiency — No per-token billing, no SaaS lock-in.
- Flexibility — You can swap or fine-tune models at will: Gemma for depth, Phi-3 for speed, Mistral for balance.
- Simplicity — Deployment is lightweight; a single Ubuntu VM can host your AI runtime.
This architecture proves that AI operations don’t have to depend on the cloud.
With the right setup, you can build your own private AI pipeline using open tools and a bit of Python.
⚙️ 3. How to Expand This Idea in Production
What we’ve built is a functional prototype — but with a few strategic improvements, it can scale into a production-grade AI observability platform.
A. Multi-Node Scaling
- Deploy multiple Ollama nodes (e.g.,
ollama-node1,ollama-node2, …) behind an Nginx load balancer. - Each node hosts the same model but handles separate analysis requests concurrently.
- This ensures parallel log analysis across dozens of servers overnight.
B. Model Switching & Fine-Tuning
- Use lightweight models like Phi-3 Mini for daily summaries.
- Reserve heavier models like Gemma or Mistral for weekly deep analysis or critical incidents.
- You can even fine-tune smaller models on your organization’s past log patterns to improve accuracy over time.
C. Integration with Monitoring Tools
- Feed AI analysis results into existing observability systems:
- Grafana Loki / Prometheus for time-series context
- Elasticsearch / Kibana for advanced search
- Slack / Email Alerts for critical anomaly notifications
- A simple webhook script can push high-severity findings automatically to your team chat.
🧩We took open-source LLMs, deployed them locally with Ollama, integrated them with rsyslog and Python —
and turned machine noise into human insight.
The next step is yours: scale it, extend it, and let your AI analyst grow with your infrastructure.