I. Introduction: Why Use Alerts and Runbooks?
When managing infrastructure in the cloud, proactive monitoring is essential. Azure Monitor allows you to detect issues using telemetry data, while Azure Automation Runbooks help you respond automatically when problems occur.
An Alert Rule defines the conditions under which Azure should raise an alert. When triggered, it can notify stakeholders, create tickets, or even execute automated scripts.
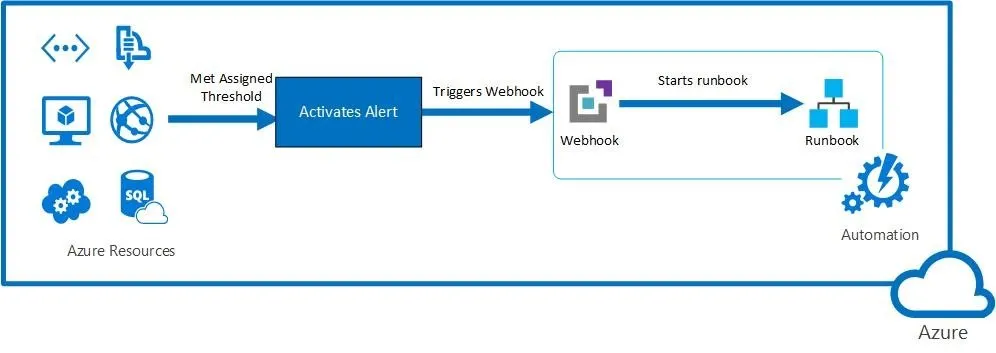
Key Components of an Alert Rule:
| Component | Description |
|---|---|
| Target Resource | The specific Azure service being monitored (VMs, Web Apps, Storage Accounts, etc.) |
| Signal Type | Metrics, Activity Logs, Application Insights logs, or custom logs emitted by the resource |
| Criteria | Logical condition applied to the signal (e.g., CPU > 80%, VM stopped) |
| Severity | Criticality of the alert (0 to 4, with 0 being most urgent) |
| Action | What happens when the alert fires (e.g., email, webhook, automation runbook) |
II. Create an Alert Rule to Monitor VM Events
Let’s walk through a scenario where we want to monitor when a Virtual Machine is stopped (deallocated) and receive notifications.
1. Create a Virtual Machine
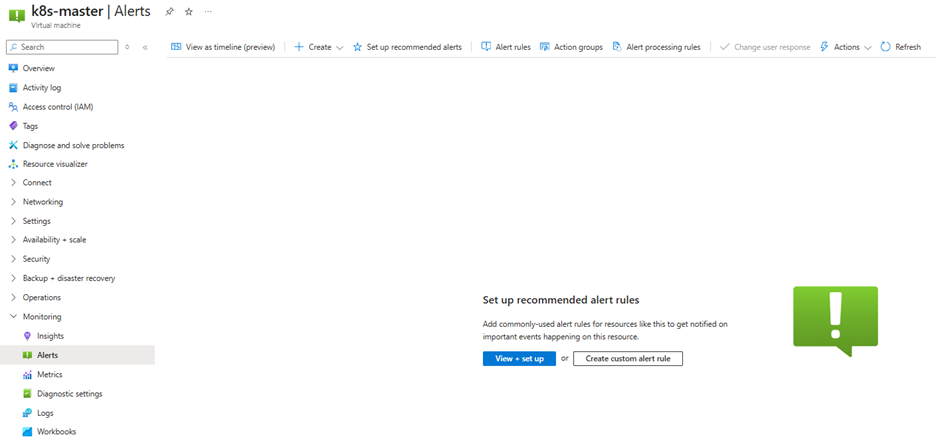
2. Navigate to the “Alerts” section and click “New alert rule”
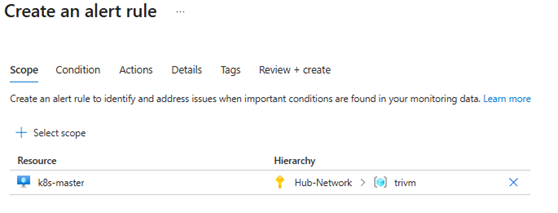
3. Scope:
Select the subscription and target VM
4. Condition:
- Choose Activity Log
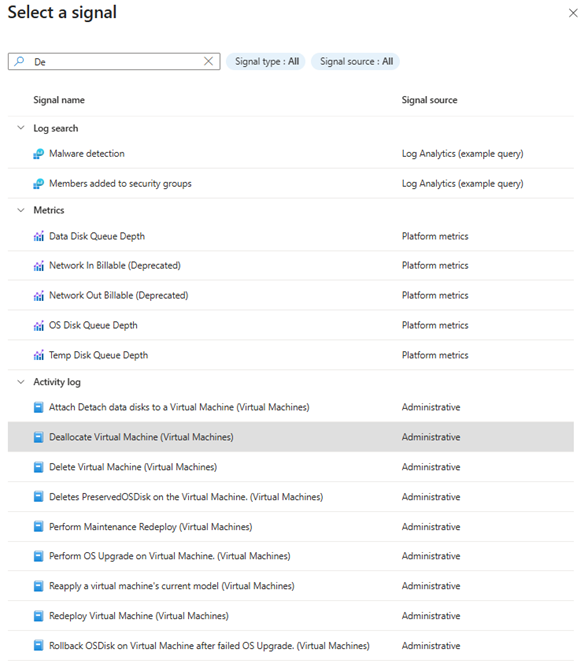
- Select the signal:
Deallocate Virtual Machine (Microsoft.Compute/virtualMachines)
5. Alert logic:
When setting up an Activity Log Alert to monitor events like stopping a Virtual Machine, Azure provides configurable logic filters under the Alert logic section. These help you fine-tune exactly when and why an alert should be triggered.
Below is a breakdown of the three default dropdowns shown in your screenshot:

- Event Level
Default value: All selected
Purpose: Filters the alert based on the severity of the event logged.
| Level | Description |
| Critical | Indicates serious issues like system failures. |
| Error | Represents failed operations or system errors. |
| Warning | A non-critical warning that might require attention. |
| Informational | General info events—e.g., VM start/stop actions. |
| Verbose | Highly detailed events, mostly used for debugging. |
✅ When monitoring for Stop VM events, it’s recommended to leave this at “All selected”, since VM deallocation is usually classified as Informational.
- Status
Default value: All selected
Purpose: Filters events by execution status.
| Status | Meaning |
| Started | Operation has begun but is not completed. |
| Succeeded | Operation completed successfully. |
| Failed | Operation failed to complete. |
| All selected | Includes all outcomes. |
✅ To ensure alerts only trigger when a VM actually stops, it’s advisable to change this to “Succeeded”—which prevents false positives if the stop action fails.
- Event Initiated By
Default value: * (All services and users)
Purpose: Defines who or what initiated the event.
| Option | Meaning |
| User (e.g., email) | Action performed by a specific user account |
| Azure service (e.g., Microsoft.Compute) | Action triggered by an Azure service or automation |
| * (All services and users) | Default—includes both users and system services |
✅ For general-purpose alerts, it’s safe to keep the default *, which covers all initiators—whether from a user, service principal, or automation.
6. Action Group:
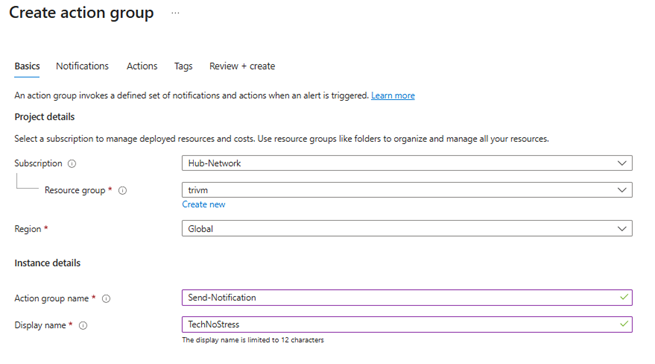
- Click “Add action group”
- Set notification type (Email/SMS/Push/Voice)

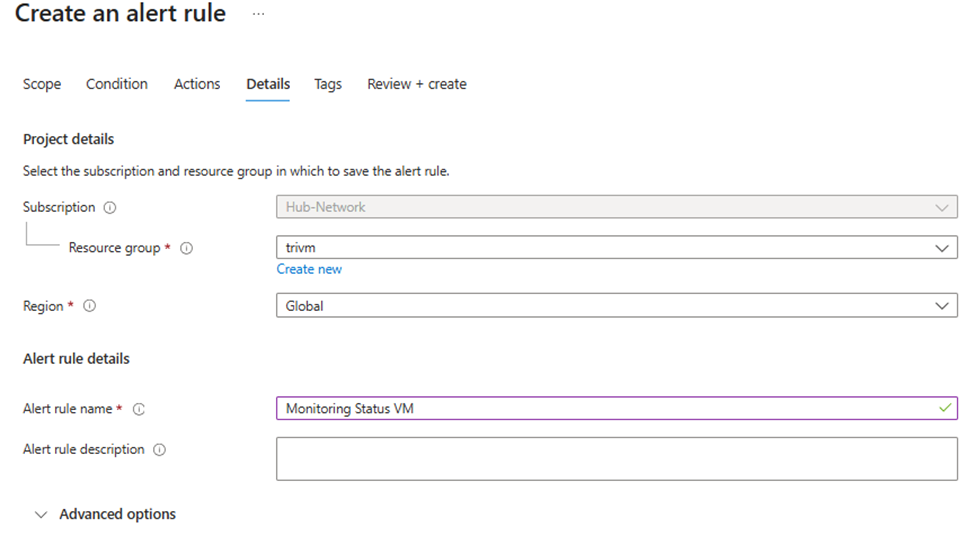
7. Review + Create the alert rule:
8. Test by manually stopping the VM:
Once your alert rule is created and the action group (with email notification) is in place, it’s time to test the setup:
- Navigate to your Virtual Machine in the Azure portal.
- Click “Stop” to deallocate the VM.
- Wait for a few moments (typically under 5 minutes) for the event to be captured by Azure Monitor.
- If the event matches the alert logic (e.g.,
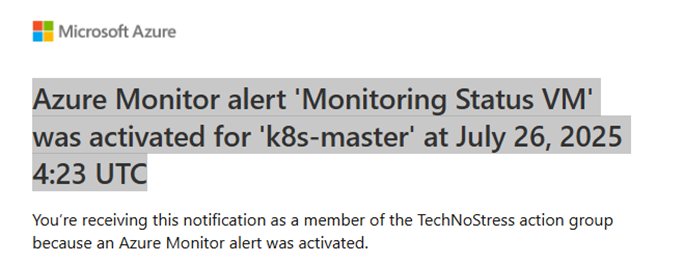
Deallocate Virtual MachinewithStatus: Succeeded), the alert will be fired and the action group will be executed. - If you configured the action group to send an email, you will receive a notification like this:
Subject:
Azure Monitor alert ‘Monitoring Status VM’ was activated for ‘k8s-master’ at July 26, 2025 4:23 UTC

III. Use an Alert to Trigger an Azure Automation Runbook
🤖 Scenario: Automatically Restart a VM When CPU Usage Exceeds 80%
Instead of manually monitoring CPU spikes and restarting VMs, we can automate this response using Azure Monitor Alerts and Automation Runbooks. Let’s build a real-world scenario where the system monitors CPU usage, and if it goes over 80% for 10 minutes, Azure will trigger a Runbook to restart the VM automatically.
✅ Step 1: Create the Azure Automation Runbook
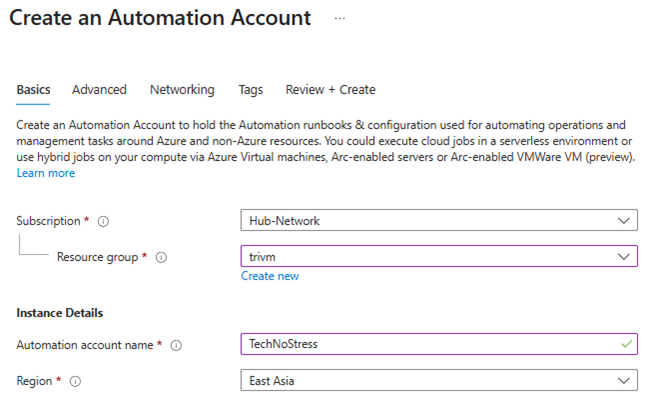
1. Go to your Azure Automation Account > Create an Automation Account
2. Navigate to Process Automation > Runbooks

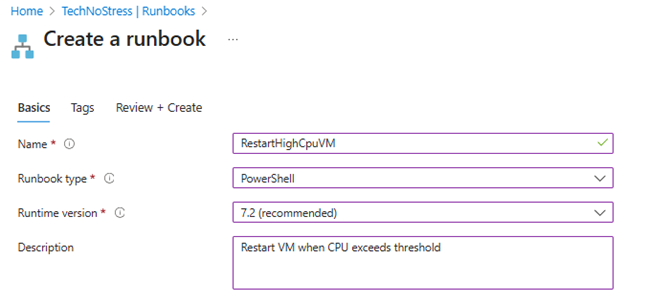
3. Click + Create a runbook
- Name:
RestartHighCpuVM - Type: PowerShell
- Description:
Restart VM when CPU exceeds threshold
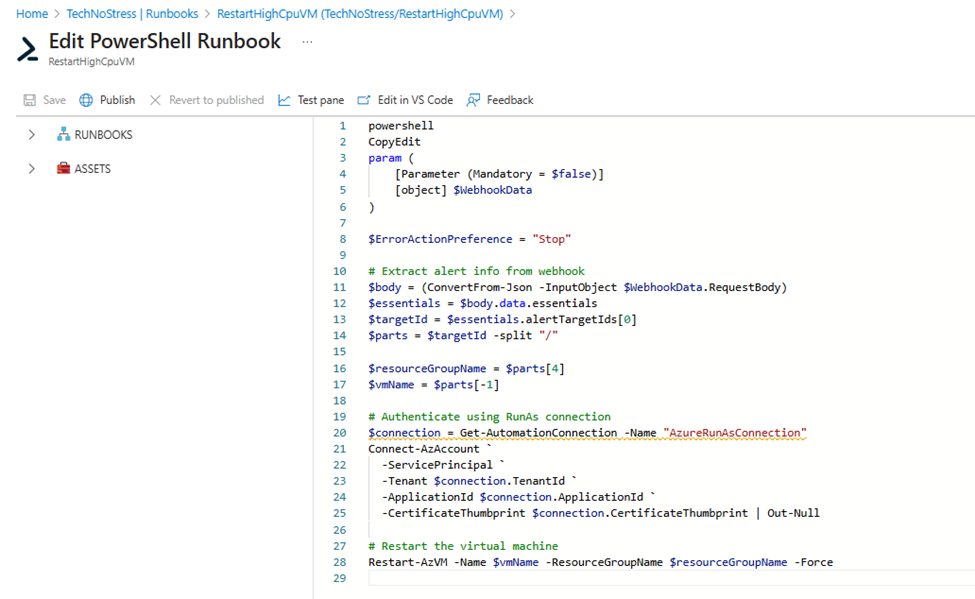
4. Paste the following PowerShell script:
param (
    [Parameter (Mandatory = $false)]
    [object] $WebhookData
)

# Step 1: Check if webhook was passed
if ($null -eq $WebhookData) {
    Write-Error "WebhookData is null. Are you running this manually?"
    return
}

try {
    Write-Output "✅ WebhookData received."

    # Step 2: Attempt to parse the JSON
    $jsonString = $WebhookData.RequestBody
    Write-Output "Preview JSON: $($jsonString.Substring(0, 200))..."

    $body = ConvertFrom-Json -InputObject $jsonString
    if ($null -eq $body.data) {
        Write-Error "Webhook body does not contain 'data' section."
        return
    }

    # Step 3: Extract info from context
    $context = $body.data.context
    $subscriptionId = $context.subscriptionId
    $resourceGroupName = $context.resourceGroupName
    $vmName = $context.resourceName
    $resourceId = $context.resourceId

    Write-Output "Parsed Subscription: $subscriptionId"
    Write-Output "Parsed Resource Group: $resourceGroupName"
    Write-Output "Parsed VM Name: $vmName"

    # Step 4: Authenticate and restart
  try {
    Connect-AzAccount -Identity
    Write-Output "✅ Connected to Azure with Managed Identity."
}
catch {
    Write-Error "❌ Failed to authenticate with Managed Identity: $_"
    return
}

try {
    Set-AzContext -SubscriptionId $subscriptionId
    Write-Output "✅ Subscription context set: $subscriptionId"
}
catch {
    Write-Error "❌ Failed to set subscription context to ${subscriptionId}: $_"
    return
}

try {
    Restart-AzVM -Name $vmName -ResourceGroupName $resourceGroupName
    Write-Output "✅ VM restart command issued successfully for: $vmName in RG: $resourceGroupName"
}
catch {
    Write-Error "❌ Failed to restart VM '${vmName}' in resource group '${resourceGroupName}': $_"
    return
}

} catch {
    Write-Error "❌ Exception during Runbook execution: $_"
}
5. Save and Publish the runbook
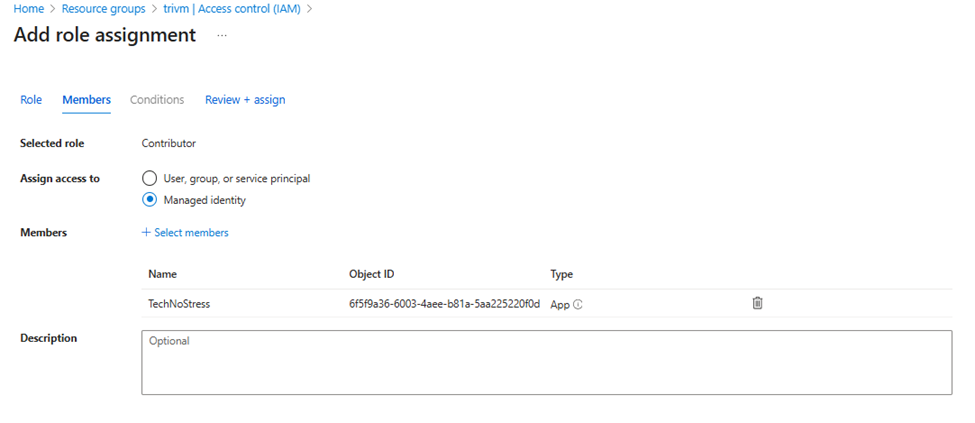
Ensure the Automation Account has Contributor rights on the VM’s resource group included VM

✅ Step 2: Create the Alert Rule for CPU > 80%
1. Navigate to the target Virtual Machine
2. Go to Alerts > + New Alert Rule
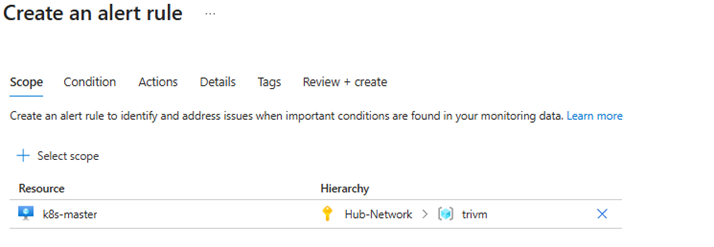
3. Scope: Select the VM
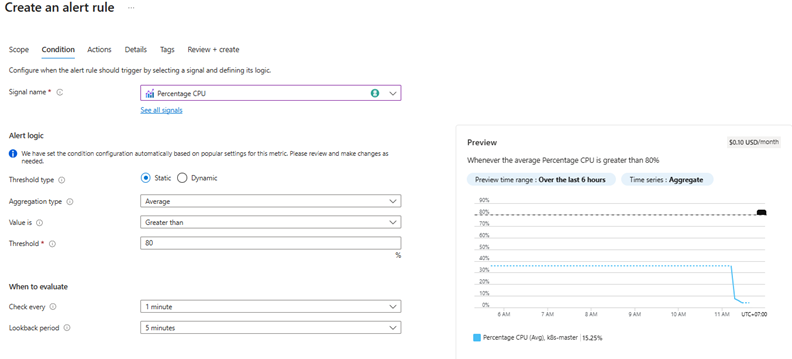
4. Condition:
- Signal:
Percentage CPU - Aggregation:
Average - Operator:
Greater than - Threshold:
80 - Check every:
1 minutes
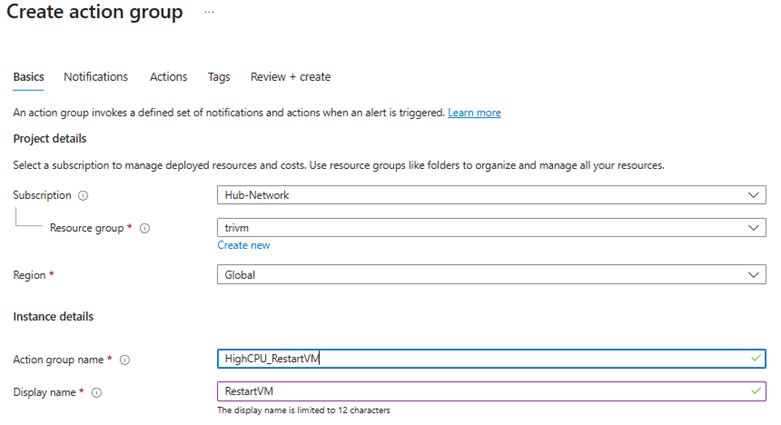
5. Action Group:
- Click “Add action group”
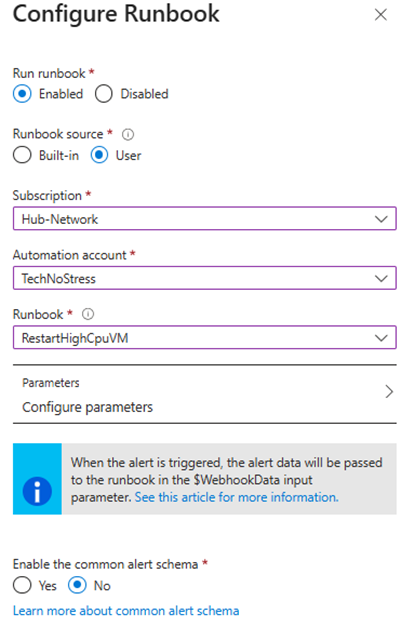
- Choose Automation Runbook as the action type
- Select your automation account and the runbook
RestartHighCpuVM - Make sure to enable webhook and keep default parameters (it carries resource info)

6. Review the alert:
- Name:
HighCPU_RestartVM - Severity:
2 - Error - Description:
Trigger runbook to restart VM when CPU > 80%
7. Click Create
✅ Step 3: Test the Flow
Simulate a CPU spike on the VM (e.g., using stress or a custom script)
To test whether the alert and automation runbook trigger correctly, you need to simulate high CPU usage on the virtual machine. Here’s how you can do it:
Install the stress utility (if not already installed):
sudo apt update
sudo apt install stress -y
Run the stress test to spike CPU:
stress --cpu 2 --timeout 600This command will use 2 CPU cores at 100% for 10 minutes (600 seconds), enough to trigger a CPU > 80% alert if your threshold is set accordingly.


Azure Monitor detects that the VM’s average CPU usage has exceeded 80% over the last evaluation period (e.g., 5 or 10 minutes).
- Alert Fires
The alert rule becomes active and sends a webhook payload to the Automation Runbook.

- View the job log under Automation > Jobs
- Runbook Starts
- In the Azure portal, under the Runbook’s Job history, you can observe a job instance with status:
- Running (when the script is executing)
- Completed (after the script finishes successfully)


- Confirm restart event in the VM Activity Log

Once the job status is “Completed”, you can verify that the VM has been restarted by connecting via SSH and running the following command
uptime🎬 Conclusion: From Insight to Action — Automating Cloud Operations
In this hands-on guide, we walked through the essential building blocks of automated monitoring and response in Azure — from identifying problems to resolving them without human intervention.
- In Part I, we discovered how Azure Monitor Alerts act as a powerful watchtower for your infrastructure, allowing you to monitor everything from VM metrics to log analytics and application health.
- In Part II, we created a real-world alert rule that watches for VM events like shutdowns, ensuring that critical changes don’t go unnoticed.
- In Part III, we turned insight into action: a high CPU alert automatically triggered a Runbook that restarted the affected VM — a true example of self-healing infrastructure.
This workflow not only saves time and reduces manual effort, but also increases system resiliency and responsiveness. With just a few steps, you’ve created an intelligent cloud automation pipeline that can detect, alert, and act — all on its own.
💡 “Let Azure do the heavy lifting—while you get back to lifting your coffee mug.”
⚡ From monitoring to resolution — fully automated, fully Azure.


