If you’ve ever had an API go down silently in production — and only found out through user complaints — you already know how critical uptime monitoring is. Today, we’ll dive into using ELK Stack with Heartbeat to monitor an API service running on a Kubernetes cluster. Not just whether it’s “up,” but also how fast it’s responding and whether it’s healthy across multiple endpoints.
I/ What Is ELK Stack and Why Heartbeat Matters in Real-Time Monitoring?
The ELK Stack (Elasticsearch + Logstash + Kibana) is widely used in logging and observability pipelines. It’s powerful for analyzing logs, visualizing metrics, and setting up alerts. But what about knowing if your service is alive, reachable, and responsive in real time?
That’s where Heartbeat comes in.
Heartbeat is the “ping” of the ELK world — it continuously checks the availability of services via HTTP, TCP, or ICMP, and reports not just up/down status, but also response time, TLS cert info, and health checks.

🔧 Real-world Use Case:
In this guide, we’ll use Heartbeat to monitor a Flask-based API deployed in Kubernetes. You’ll see how to track:
- Service availability (/items, /total)
- Response latency over time
II/ Step-by-Step Demo: ELK + Heartbeat Monitoring an API Service on Kubernetes:
Let’s walk through a real working demo.
1/Deploy the API Demo Container on Kubernetes:
We’ll use a prebuilt Docker image:
📦 vmt1991/flask-elk-demo
This Flask API exposes:
- GET /items: returns a list of warehouse items
- GET /total: returns the total count of items
📁 deployment-api.yaml
apiVersion: apps/v1
kind: Deployment
metadata:
  name: flask-api
spec:
  replicas: 2
  selector:
    matchLabels:
      app: flask-api
  template:
    metadata:
      labels:
        app: flask-api
    spec:
      containers:
      - name: api
        image: vmt1991/flask-elk-demo
        ports:
        - containerPort: 8080
---
apiVersion: v1
kind: Service
metadata:
  name: flask-api-service
spec:
  type: NodePort
  selector:
    app: flask-api
  ports:
    - port: 8080
      targetPort: 8080
      nodePort: 32600
✅ Deploy it
kubectl apply -f deployment-api.yaml
Once deployed, the service will be accessible via
http://<node-ip>:32600/items
http://<node-ip>:32600/total
2/Deploy Heartbeat to Monitor the API:
Now let’s configure Heartbeat to check these endpoints every 30 seconds and report status + response time to the ELK stack.
🛠 Key Config Goals:
- Monitor 2 endpoints: /items and /total
- Push metrics to Elasticsearch at https://10.1.0.4:9200
- Use credentials: elastic / ESadmin@123
- Disable SSL verification for simplicity
- Deploy Heartbeat as a container inside the same K8s cluster
📁 heartbeat.yaml (stored on path /etc/heartbeat/heartbeat.yml)
heartbeat.monitors:
  - type: http
    name: "API - Items Endpoint"
    schedule: "@every 30s"
    urls: ["http://flask-api-service:8080/items"]
    check.response.status: 200

  - type: http
    name: "API - Total Endpoint"
    schedule: "@every 30s"
    urls: ["http://flask-api-service:8080/total"]
    check.response.status: 200

setup.kibana:
  host: "http://10.1.0.6:5601"

setup.dashboards.enabled: false

output.elasticsearch:
  hosts: ["https://10.1.0.4:9200"]
  username: "elastic"
  password: "ESadmin@123"
  ssl.verification_mode: none
📁Create the ConfigMap:
kubectl create configmap heartbeat-config \
--from-file=heartbeat.yml=/etc/heartbeat/heartbeat.yml \- heartbeat-config is the name of the ConfigMap
- –from-file=heartbeat.yml=… ensures the key in the ConfigMap is heartbeat.yml

📁 heartbeat-deployment.yaml
apiVersion: apps/v1
kind: Deployment
metadata:
  name: heartbeat
  labels:
    app: heartbeat
spec:
  replicas: 1
  selector:
    matchLabels:
      app: heartbeat
  template:
    metadata:
      labels:
        app: heartbeat
    spec:
      containers:
        - name: heartbeat
          image: docker.elastic.co/beats/heartbeat:9.0.0
          args: ["-c", "/usr/share/heartbeat/heartbeat.yml", "-e"]
          volumeMounts:
            - name: config-volume
              mountPath: /usr/share/heartbeat/heartbeat.yml
              subPath: heartbeat.yml
      volumes:
        - name: config-volume
          configMap:
            name: heartbeat-config

---
apiVersion: v1
kind: Service
metadata:
  name: heartbeat-service
  labels:
    app: heartbeat
spec:
  selector:
    app: heartbeat
  ports:
    - port: 5066
      targetPort: 5066
      protocol: TCP
      name: monitoring
✅ Deploy Heartbeat
kubectl apply -f heartbeat-deployment.yaml
📈 2. Check for Metrics already loaded to Elasticsearch:
Open your Kibana UI
Go to: Management> Stack Management > Kibana > Data Views > heartbeat-*

Go to: Analytics > Discover > Choose Data View heartbeat-*

3/Visualize API Health & Response in Kibana:
Once Heartbeat is up and pushing metrics to Elasticsearch — and your data view heartbeat-* is in place — it’s time to see your API come alive inside Kibana. The good news? If you’re using ELK 8 or above, you don’t need to manually import .ndjson dashboards anymore. Kibana now comes with a fully interactive Uptime interface, dynamically powered by the data from your Heartbeat monitors.
🔍 Head Over to Uptime:
Kibana → Observability → Uptime
Here, you’ll see a real-time list of all monitored endpoints — including the ones from our Flask API:
- /items
- /total

Want to track how fast each of your endpoints responds?
Here’s where the magic happens 👇
Head to Uptime → Click on the name of any monitor
(For example: “API – /items”)
You’ll land on the Monitor Detail View, where things get much more insightful.
What you’ll see:
- A ping timeline, showing the status checks over time
- A response time chart labeled Monitor duration — this is your endpoint’s latency trend
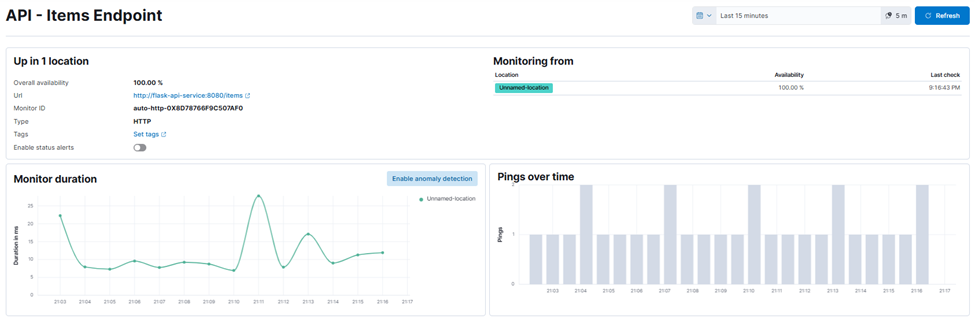
📌 That response time chart is exactly what you’re looking for
III/ Summary: What You’ve Built and Learned
In this post, you walked through a full implementation of API uptime monitoring on Kubernetes using ELK Stack and Heartbeat.
Here’s what you accomplished:
- Deployed a Flask-based API service on Kubernetes using a Docker image and NodePort
- Configured and deployed Heartbeat as a container to monitor real API endpoints (/items and /total)
- Connected Heartbeat to a secure Elasticsearch server, with SSL and credentials
- Sent live availability and latency metrics to the ELK stack
- Visualized uptime, response time, and endpoint health through Kibana’s native Uptime UI
- Explored practical dashboards and monitor detail views to understand service performance in real time
With this setup, you’re no longer flying blind.
You’re tracking your API’s real-world performance — with full-stack observability, inside your Kubernetes cluster.
🫀 “If your API goes down in the forest and no one’s monitoring it, does it even exist?”